

Medicine - Veterinary > Veterinary colleges and laboratories > Indian journal of veterinary science and animal husbandry > Volume 4, 1934 > Original articles > Wool-growth in sheep as affected by the carbohydrate-content of the diet
(290) Page 260
Download files
Individual page:
Thumbnail gallery: Grid view | List view
260 THE INDIAN JOURNAL OF VETERINARY SCIENCE AND ANIMAL HUSBANDRY [ IV, III
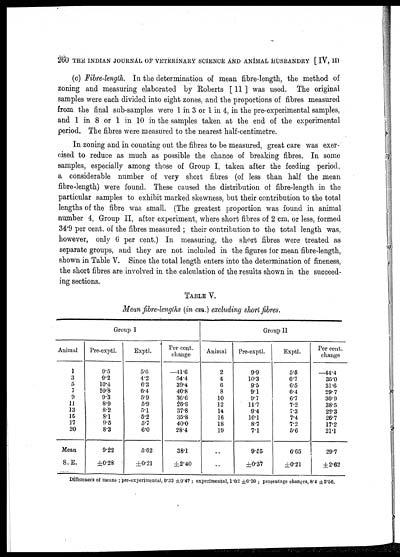
(c) Fibre-length. In the determination of mean fibre-length, the method of
zoning and measuring elaborated by Roberts [ 11 ] was used. The original
samples were each divided into eight zones, and the proportions of fibres measured
from the final sub-samples were 1 in 3 or 1 in 4, in the pre-experimental samples,
and 1 in 8 or 1 in 10 in the samples taken at the end of the experimental
period. The fibres were measured to the nearest half-centimetre.
In zoning and in counting out the fibres to be measured, great care was exer-
cised to reduce as much as possible the chance of breaking fibres. In some
samples, especially among those of Group I, taken after the feeding period,
a considerable number of very short fibres (of less than half the mean
fibre-length) were found. These caused the distribution of fibre-length in the
particular samples to exhibit marked skewness, but their contribution to the total
lengths of the fibre was small. (The greatest proportion was found in animal
number 4, Group II, after experiment, where short fibres of 2 cm. or less, formed
34.9 per cent. of the fibres measured ; their contribution to the total length was,
however, only 6 per cent.) In measuring, the short fibres were treated as
separate groups, and they are not included in the figures for mean fibre-length,
shown in Table V. Since the total length enters into the determination of fineness,
the short fibres are involved in the calculation of the results shown in the succeed-
ing sections.
TABLE V.
Mean fibre-lenglhs (in cm.) excluding short fibres.
|
Group I |
Group II |
||||||
|
Animal |
Pre-exptl. |
Exptl. |
Per cent. |
Animal |
Pre-exptl. |
Exptl. |
Per cent. |
|
1 |
9.5 |
5.6 |
—41.6 |
2 |
9.9 |
5.5 |
—44.4 |
|
3 |
9.2 |
4.2 |
54.4 |
4 |
10.3 |
6.7 |
35.0 |
|
5 |
10.4 |
6.3 |
39.4 |
6 |
9.5 |
6.5 |
31.6 |
|
7 |
10.8 |
6.4 |
40.8 |
8 |
9.1 |
6.4 |
29.7 |
|
9 |
9.3 |
5.9 |
36.6 |
10 |
9.7 |
6.7 |
30.9 |
|
11 |
8.9 |
5.9 |
26.8 |
12 |
11.7 |
7.2 |
38.5 |
|
13 |
8.2 |
5.l |
37.8 |
14 |
9.4 |
7.3 |
22.3 |
|
15 |
8.1 |
5.2 |
35.8 |
16 |
10.1 |
7.4 |
26.7 |
|
17 |
9.5 |
5.7 |
40.0 |
18 |
8.7 |
7.2 |
17.2 |
|
20 |
8.3 |
6.0 |
28.4 |
19 |
7.1 |
5.6 |
21.1 |
|
Mean |
9.22 |
5.62 |
38.1 |
.. |
9.55 |
6.65 |
29.7 |
|
S.E. |
±0.28 |
±0.21 |
±2.40 |
.. |
±0.37 |
±0.21 |
±2.62 |
Differences of means ; pre-experimental, 0.33 ±0.47 ; experimental, 1.02 ±0.30 ; percentage changes, 8 .4 ±3.56.
Set display mode to: Large image | Zoom image | Transcription
Images and transcriptions on this page, including medium image downloads, may be used under the Creative Commons Attribution 4.0 International Licence unless otherwise stated. ![]()
| Permanent URL | https://digital.nls.uk/75234586 |
|---|
| Description | Covers articles from 1934. |
|---|
| Description | Volumes 1-29 cover a wide range of topics related to veterinary science and animal husbandry. Black and white and colour plates accompany some articles. Each volume covers one year and has indexes to both authors and subjects at the end. Reviews, obituaries and abstracts are also included. |
|---|---|
| Shelfmark | IP/RA.11 |
| Additional NLS resources: | |
| Attribution and copyright: |
|
| Description | Reports from veterinary colleges and annual reports of the Imperial Bacteriologist. Plus volumes of the Indian Journal of Veterinary Science and Animal Husbandry covering 1931-1959. |
|---|---|
| Shelfmark | India Papers |
| Description | The Veterinary collection consists of 146 volumes dating from 1864 to 1959. Divided into veterinary diseases, colleges and laboratories and Civil Veterinary Departments. Extensive research on trypanosomiasis and rinderpest. Reports show how veterinary medicine controlled disease, maintained livestock and alleviated famine. They explore its effect on military and local communities. |
|---|---|
| Shelfmark | India Papers |
| Description | The India Papers collection contains publications of the central (Imperial) Government and many Indian states. Most states came under British rule. Much of the collection dates from between the post-Mutiny re-organisation of the Indian Government and Indian Independence in 1947. Some items published in London by John Murray. |
|---|---|
| Shelfmark | India Papers |
| Additional NLS resources: | |