Download files
Complete book:
Individual page:
Thumbnail gallery: Grid view | List view
20
quently relate only to a proportion varying from country to country of the total output. While
it may be permissible to deduce the trend of consumption from such figures within any one
country, the comparison of average consumption in one country with that in another is less
justifiable. The difficulties are intensified when domestic consumption constitutes only a small
proportion of production, as, for example, in most countries in the case of milk for consump¬
tion in liquid form, or, in New Zealand, in the case of mutton and lamb. It is with consi¬
derable hesitation that the figures in the following paragraph, and in Appendix II, Tables I-X
are submitted, and it is imperative that they should not be regarded as more than a first and
purely tentative essay, which further research might cause to be altered in several instances.
For the most part, the international comparisons are more or less in accordance with expecta¬
tions, but in a few instances there are surprising differences which give rise to suspicion as to
the reliability of the figures.
Milk and Dairy Produce.
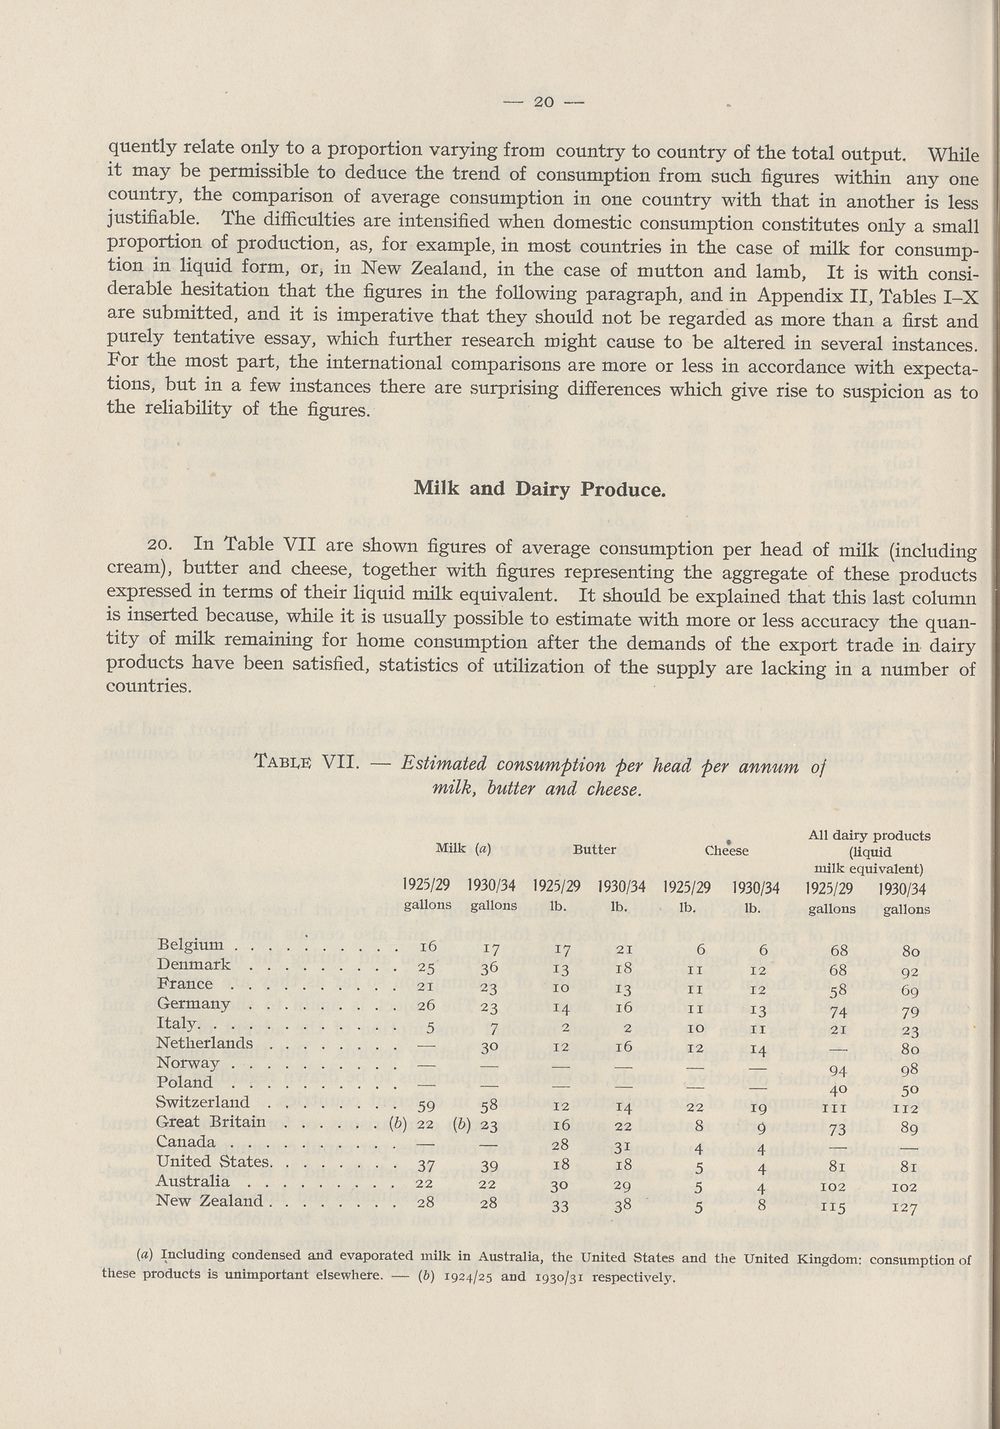
20. In Table VII are shown figures of average consumption per head of milk (including
cream), butter and cheese, together with figures representing the aggregate of these products
expressed in terms of their liquid milk equivalent. It should be explained that this last column
is inserted because, while it is usually possible to estimate with more or less accuracy the quan¬
tity of milk remaining for home consumption after the demands of the export trade in dairy
products have been satisfied, statistics of utilization of the supply are lacking in a number of
countries.
Tabu; VII.
Estimated consumption per head per annum of
milk, butter and cheese.
Milk (a)
Butter
Cheese
1925/29
gallons
Belgium
Denmark
France
Germany
Italy
Netherlands
Norway
Poland
Switzerland
Great Britain ....
Canada
United States 37
Australia 22
New Zealand 28
16
25
21
26
5
1930/34
gallons
17
36
23
23
7
30
(6) 22 (&)
58
23
39
22
28
1925/29
lb.
17
13
10
J4
12
16
28
18
30
33
1930/34
lb.
21
18
13
16
2
16
14
22
3i
18
29
38
1925/29
lb.
6
11
11
11
10
12
22
8
4
5
5
5
1930/34
lb.
6
12
12
13
11
14
19
9
4
4
4
8
All dairy products
(liquid
milk equivalent)
1925/29 1930/34
gallons gallons
68
68
58
74
21
94
40
in
73
81
102
US
80
92
69
79
23
80
98
50
112
89
81
102
127
{a) Including condensed and evaporated milk in Australia, the United States and the United Kingdom: consumption of
these products is unimportant elsewhere. — (b) 1924/25 and 1930/31 respectively.
quently relate only to a proportion varying from country to country of the total output. While
it may be permissible to deduce the trend of consumption from such figures within any one
country, the comparison of average consumption in one country with that in another is less
justifiable. The difficulties are intensified when domestic consumption constitutes only a small
proportion of production, as, for example, in most countries in the case of milk for consump¬
tion in liquid form, or, in New Zealand, in the case of mutton and lamb. It is with consi¬
derable hesitation that the figures in the following paragraph, and in Appendix II, Tables I-X
are submitted, and it is imperative that they should not be regarded as more than a first and
purely tentative essay, which further research might cause to be altered in several instances.
For the most part, the international comparisons are more or less in accordance with expecta¬
tions, but in a few instances there are surprising differences which give rise to suspicion as to
the reliability of the figures.
Milk and Dairy Produce.
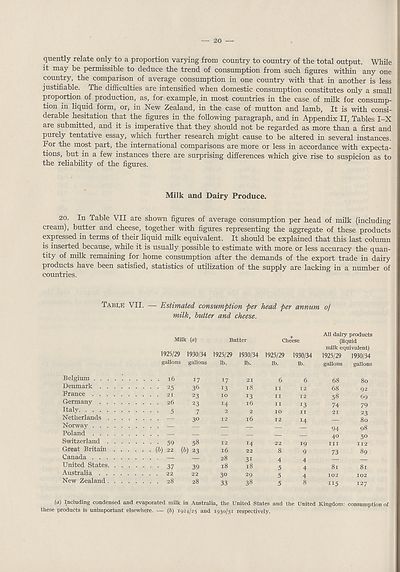
20. In Table VII are shown figures of average consumption per head of milk (including
cream), butter and cheese, together with figures representing the aggregate of these products
expressed in terms of their liquid milk equivalent. It should be explained that this last column
is inserted because, while it is usually possible to estimate with more or less accuracy the quan¬
tity of milk remaining for home consumption after the demands of the export trade in dairy
products have been satisfied, statistics of utilization of the supply are lacking in a number of
countries.
Tabu; VII.
Estimated consumption per head per annum of
milk, butter and cheese.
Milk (a)
Butter
Cheese
1925/29
gallons
Belgium
Denmark
France
Germany
Italy
Netherlands
Norway
Poland
Switzerland
Great Britain ....
Canada
United States 37
Australia 22
New Zealand 28
16
25
21
26
5
1930/34
gallons
17
36
23
23
7
30
(6) 22 (&)
58
23
39
22
28
1925/29
lb.
17
13
10
J4
12
16
28
18
30
33
1930/34
lb.
21
18
13
16
2
16
14
22
3i
18
29
38
1925/29
lb.
6
11
11
11
10
12
22
8
4
5
5
5
1930/34
lb.
6
12
12
13
11
14
19
9
4
4
4
8
All dairy products
(liquid
milk equivalent)
1925/29 1930/34
gallons gallons
68
68
58
74
21
94
40
in
73
81
102
US
80
92
69
79
23
80
98
50
112
89
81
102
127
{a) Including condensed and evaporated milk in Australia, the United States and the United Kingdom: consumption of
these products is unimportant elsewhere. — (b) 1924/25 and 1930/31 respectively.
Set display mode to:
![]() Universal Viewer |
Universal Viewer | ![]() Mirador |
Large image | Transcription
Mirador |
Large image | Transcription
Images and transcriptions on this page, including medium image downloads, may be used under the Creative Commons Attribution 4.0 International Licence unless otherwise stated. ![]()
| League of Nations > Economic and financial section > Problem of nutrition > (22) |
|---|
| Permanent URL | https://digital.nls.uk/190927636 |
|---|
| Description | Vol. 4. Statistics of food production, consumption and prices. |
|---|---|
| Shelfmark | LN.II.28.(4) |
| Attribution and copyright: |
|
| Shelfmark | LN.II |
|---|
| Description | Over 1,200 documents from the non-political organs of the League of Nations that dealt with health, disarmament, economic and financial matters for the duration of the League (1919-1945). Also online are statistical bulletins, essential facts, and an overview of the League by the first Secretary General, Sir Eric Drummond. These items are part of the Official Publications collection at the National Library of Scotland. |
|---|---|
| Additional NLS resources: |
|