Download files
Complete book:
Individual page:
Thumbnail gallery: Grid view | List view
— 19 —
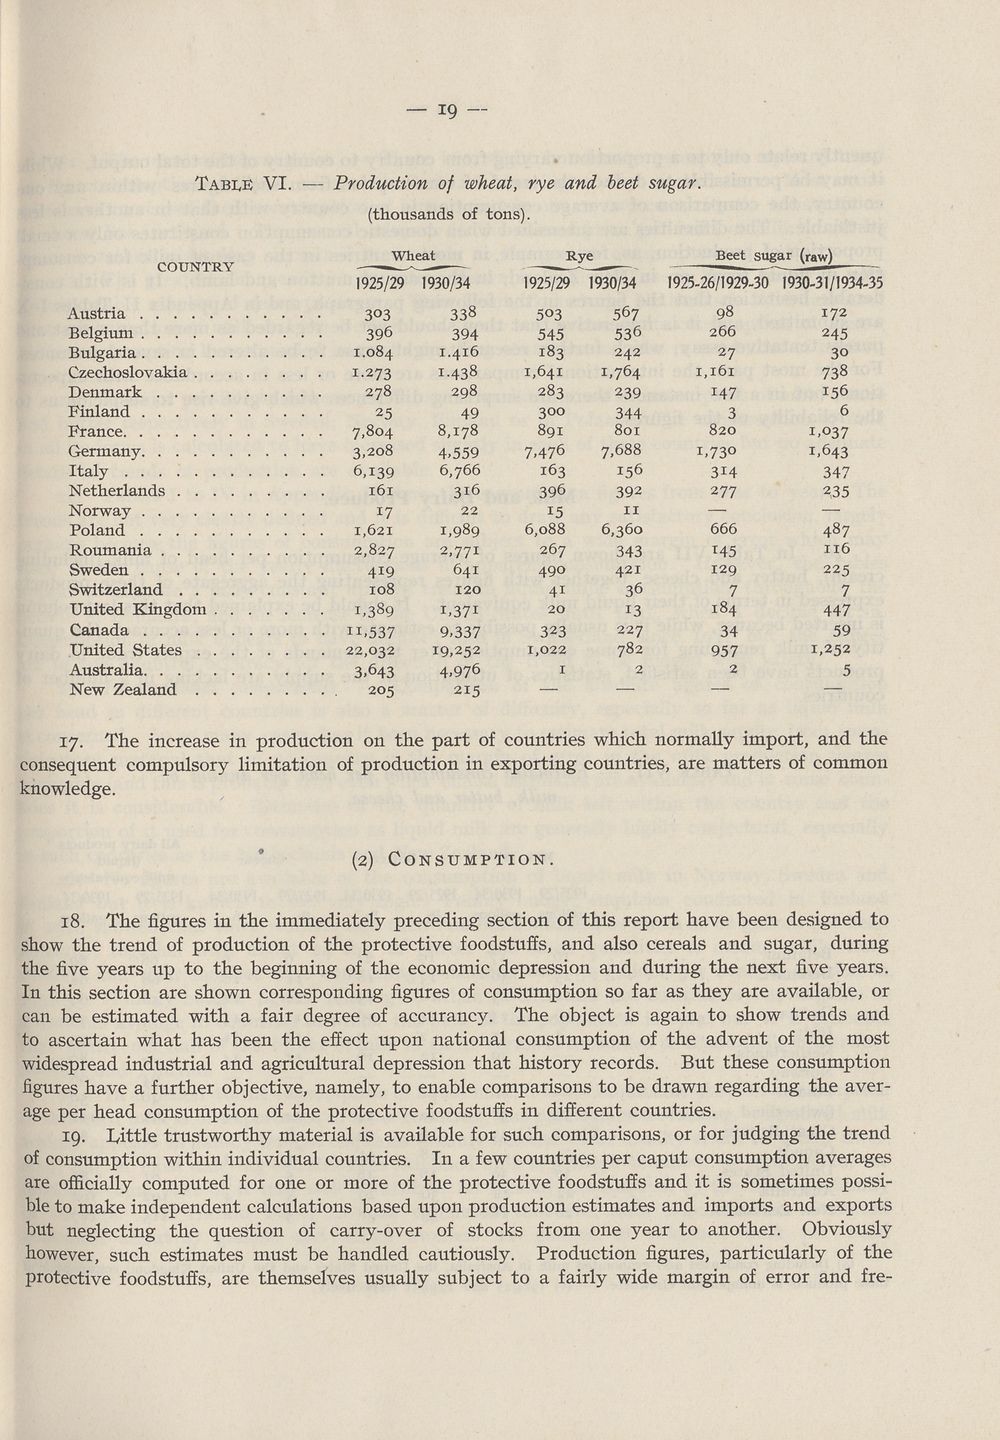
Table VI. — Production of wheat, rye and beet sugar.
(thousands of tons).
Wheat
COUNTRY —
1925/29 1930/34
Austria 303 338
Belgium 396 394
Bulgaria 1.084 1.416
Czechoslovakia 1-273 1.438
Denmark 278 298
Finland 25 49
France 7.804 8,178
Germany 3,208 4,559
Italy 6,139 6,766
Netherlands 161 316
Norway 17 22
Poland 1,621 1,989
Roumania 2,827 2,771
Sweden 419 641
Switzerland 108 120
United Kingdom 1,389 1,371
Canada n,537 9,337
United States 22,032 19,252
Australia 3,643 4,976
New Zealand 205 215
Rye
1925/29 1930/34
Beet sugar (raw)
1925-26/1929-30 1930-31/1934-35
503
545
183
1,641
283
300
891
7,476
163
396
15
6,088
267
490
4i
20
323
1,022
1
567
536
242
1,764
239
344
801
7,688
156
392
11
6,360
343
421
36
13
227
782
98
266
27
1,161
I47
3
820
i,73°
3i4
277
666
T45
129
7
184
34
957
2
172
245
30
738
156
6
1,037
1,643
347
2,35
487
116
225
7
447
59
1,252
5
17. The increase in production on the part of countries which normally import, and the
consequent compulsory limitation of production in exporting countries, are matters of common
knowledge.
(2) Consumption.
18. The figures in the immediately preceding section of this report have been designed to
show the trend of production of the protective foodstuffs, and also cereals and sugar, during
the five years up to the beginning of the economic depression and during the next five years.
In this section are shown corresponding figures of consumption so far as they are available, or
can be estimated with a fair degree of accurancy. The object is again to show trends and
to ascertain what has been the effect upon national consumption of the advent of the most
widespread industrial and agricultural depression that history records. But these consumption
figures have a further objective, namely, to enable comparisons to be drawn regarding the aver¬
age per head consumption of the protective foodstuffs in different countries.
19. Tittle trustworthy material is available for such comparisons, or for judging the trend
of consumption within individual countries. In a few countries per caput consumption averages
are officially computed for one or more of the protective foodstuffs and it is sometimes possi¬
ble to make independent calculations based upon production estimates and imports and exports
but neglecting the question of carry-over of stocks from one year to another. Obviously
however, such estimates must be handled cautiously. Production figures, particularly of the
protective foodstuffs, are themselves usually subject to a fairly wide margin of error and fre-
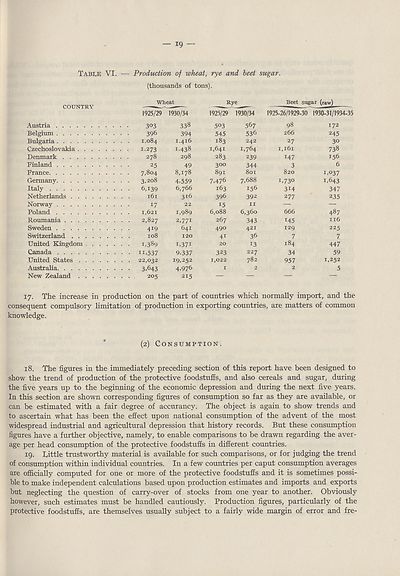
Set display mode to:
![]() Universal Viewer |
Universal Viewer | ![]() Mirador |
Large image | Transcription
Mirador |
Large image | Transcription
Images and transcriptions on this page, including medium image downloads, may be used under the Creative Commons Attribution 4.0 International Licence unless otherwise stated. ![]()
| League of Nations > Economic and financial section > Problem of nutrition > (21) |
|---|
| Permanent URL | https://digital.nls.uk/190927623 |
|---|
| Description | Vol. 4. Statistics of food production, consumption and prices. |
|---|---|
| Shelfmark | LN.II.28.(4) |
| Attribution and copyright: |
|
| Shelfmark | LN.II |
|---|
| Description | Over 1,200 documents from the non-political organs of the League of Nations that dealt with health, disarmament, economic and financial matters for the duration of the League (1919-1945). Also online are statistical bulletins, essential facts, and an overview of the League by the first Secretary General, Sir Eric Drummond. These items are part of the Official Publications collection at the National Library of Scotland. |
|---|---|
| Additional NLS resources: |
|