Medicine - Vaccination > 1877-1929 - Report on vaccination in the Madras Presidency > Report on vaccination in Madras 1922-1929 > 1923-1924 - Report on vaccination in the Madras Presidency for the year 1923-24
(158) Page 25
Download files
Individual page:
Thumbnail gallery: Grid view | List view

25
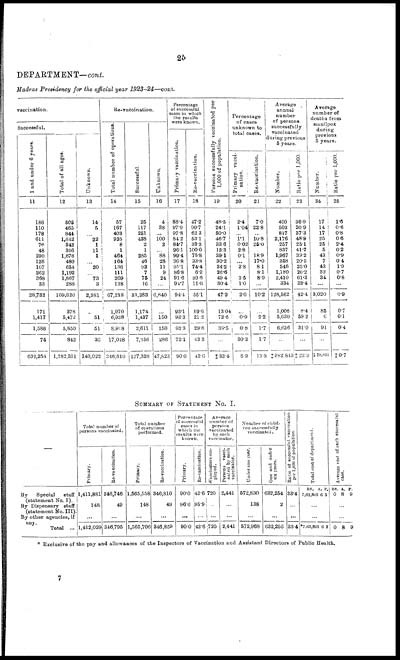
DEPARTMENT—cont.
Madras Presidency for the official year 1923-24—cont.
|
vaccination. |
Re-vaccination. |
Percentage |
Persons successfully vaccinated per |
Percentage |
Average |
Average |
||||||||
|
Successful. |
Total number of operations. |
Successful. |
Unknown. |
|||||||||||
|
Primary vaccination. |
Re-vaccination. |
|||||||||||||
|
1 and under 6 years. |
Total of all ages. |
Unknown. |
||||||||||||
|
Primary vacci- |
Re-vaccination. |
Number. |
Ratio per 1,000. |
Number. |
Ratio per 1,000. |
|||||||||
|
11 |
12 |
13 |
14 |
15 |
16 |
17 |
18 |
19 |
20 |
21 |
22 |
23 |
24 |
25 |
|
186 |
505 |
14 |
57 |
25 |
4 |
88.4 |
47.2 |
48.5 |
2.4 |
7.0 |
400 |
36.9 |
17 |
1.6 |
|
110 |
465 |
5 |
167 |
117 |
38 |
97.9 |
90.7 |
24.1 |
1.04 |
22.8 |
503 |
20.9 |
14 |
0.6 |
|
178 |
844 |
... |
403 |
251 |
... |
97.8 |
62.3 |
50.0 |
... |
... |
817 |
37.3 |
17 |
0.8 |
|
611 |
1,642 |
22 |
925 |
438 |
100 |
84.2 |
53.1 |
46.7 |
1.1 |
10.8 |
2,176 |
48.9 |
25 |
0.6 |
|
76 |
342 |
1 |
8 |
2 |
2 |
84.7 |
33.3 |
33.6 |
0.02 |
25.0 |
257 |
25.1 |
25 |
2.4 |
|
48 |
366 |
11 |
1 |
1 |
... |
96.1 |
100.0 |
13.3 |
2.8 |
... |
837 |
41.7 |
5 |
0.2 |
|
290 |
1,676 |
1 |
464 |
285 |
88 |
99.4 |
75.8 |
39.1 |
0.1 |
18.9 |
1,967 |
39.2 |
43 |
0.9 |
|
126 |
480 |
... |
164 |
46 |
28 |
96.8 |
33.8 |
30.2 |
... |
17.0 |
358 |
20.5 |
7 |
0.4 |
|
107 |
654 |
20 |
136 |
93 |
11 |
95.1 |
74.4 |
34.2 |
2.8 |
8.1 |
546 |
25.0 |
43 |
1.9 |
|
262 |
1,192 |
... |
111 |
7 |
9 |
86.8 |
6.9 |
26.6 |
... |
8.1 |
1,180 |
26.2 |
32 |
0.7 |
|
368 |
1,867 |
73 |
269 |
75 |
24 |
91.6 |
30.6 |
49.4 |
3.5 |
8.9 |
2,410 |
61.3 |
34 |
0.8 |
|
33 |
288 |
3 |
138 |
16 |
... |
94.7 |
11.6 |
30.4 |
1.0 |
... |
334 |
33.4 |
... |
... |
|
28,732 |
109,620 |
2,381 |
67,218 |
33,283 |
6,840 |
94.4 |
55.1 |
47.2 |
2.0 |
10.2 |
128,562 |
42.4 |
3,020 |
0.9 |
|
171 |
378 |
... |
1,970 |
1,174 |
... |
93.1 |
59.6 |
13.04 |
... |
... |
1,006 |
8.4 |
85 |
0.7 |
|
1,417 |
5,472 |
51 |
6,938 |
1,437 |
150 |
93.3 |
21.2 |
72.6 |
0.9 |
2.2 |
5,630 |
59.2 |
6 |
0.1 |
|
1,588 |
5,850 |
51 |
8,908 |
2,611 |
150 |
93.3 |
29.8 |
39.5 |
0.8 |
1.7 |
6,636 |
31.0 |
91 |
0.4 |
|
74 |
842 |
36 |
17,048 |
7,256 |
286 |
73.1 |
43.3 |
... |
30.3 |
1.7 |
... |
... |
... |
... |
|
632,254 |
1,282,351 |
140,022 |
346,810 |
127,338 |
47,823 |
90.0 |
42.6 |
‡33.4 |
8.9 |
13.3 |
‡ 982,843 |
‡23.3 |
‡ 29,831 |
‡ 0.7 |
SUMMARY OF STATEMENT No. I.
|
— |
Total number of |
Total number |
Percentage |
Average |
Number of child- |
Ratio of successful vaccination |
Total cost of department. |
Average cost of each successful |
|||||||||
|
Primary. |
Re-vaccination. |
Primary. |
Re-vaccination. |
Primary. |
Re-vaccination. |
Vaccinators em- |
Persons vacci- |
Under one year. |
One and under |
||||||||
|
RS. |
A. |
P. |
RS. |
A. |
P. |
||||||||||||
|
By Special staff |
1,411,881 |
346,746 |
1,565,558 |
346,810 |
90.0 |
42.6 |
720 |
2,441 |
572,830 |
632,254 |
33.4 |
7,63,893 |
6 |
3 |
0 |
8 |
9 |
|
By Dispensary staff |
148 |
49 |
148 |
49 |
96.6 |
95.9 |
... |
... |
138 |
2 |
... |
... |
... |
||||
|
By other agencies, if |
... |
... |
... |
... |
... |
... |
... |
... |
... |
... |
... |
... |
... |
||||
|
Total ... |
1,412,029 |
346,795 |
1,565,706 |
346,859 |
90.0 |
42.6 |
720 |
2,441 |
572,968 |
632,256 |
33.4 |
*7,63,893 |
6 |
3 |
0 |
8 |
9 |
* Exclusive of the pay and allowances of the Inspectors of Vaccination and Assistant Directors of Public Health.
7
Set display mode to: Large image | Zoom image | Transcription
Images and transcriptions on this page, including medium image downloads, may be used under the Creative Commons Attribution 4.0 International Licence unless otherwise stated. ![]()
| Permanent URL | https://digital.nls.uk/91180229 |
|---|
| Attribution and copyright: |
|
|---|


