Medicine - Vaccination > 1877-1929 - Report on vaccination in the Madras Presidency > Report on vaccination in Madras 1922-1929 > 1923-1924 - Report on vaccination in the Madras Presidency for the year 1923-24
(157) Page 24
Download files
Individual page:
Thumbnail gallery: Grid view | List view

24
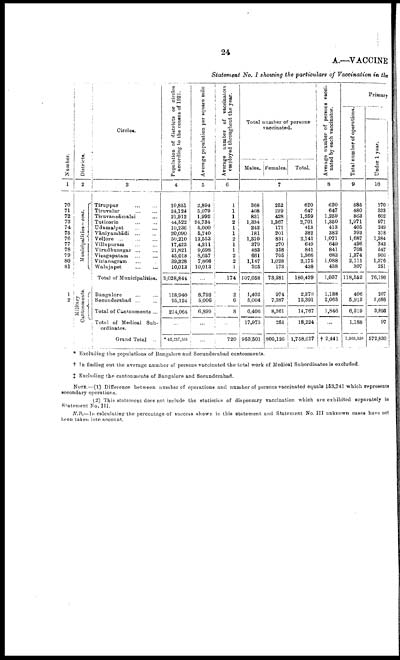
A.—VACCINE
Statement No. I showing the particulars of Vaccination in the
|
Number. |
Districts. |
Circles. |
Population of districts or circles |
Average population per square mile |
Average number of vaccinators |
Total number of persons |
Average number of persons vacci- |
Primary |
|||
|
Total number of operations. |
|||||||||||
|
Under 1 year. |
|||||||||||
|
Males. |
Females. |
Total. |
|||||||||
|
1 |
2 |
3 |
4 |
5 |
6 |
7 |
8 |
9 |
10 |
||
|
70 |
Municipalities — cont. |
Tiruppur ... ... |
10,851 |
2,894 |
1 |
368 |
252 |
620 |
620 |
585 |
270 |
|
71 |
Tiruvalur ... ... |
24,124 |
5,079 |
1 |
408 |
239 |
647 |
647 |
480 |
333 |
|
|
72 |
Tiruvannāmalai ... |
21,912 |
1,992 |
1 |
831 |
428 |
1,259 |
1,259 |
863 |
602 |
|
|
73 |
Tuticorin ... ... |
44,522 |
24,734 |
2 |
1,334 |
1,367 |
2,701 |
1,350 |
1,971 |
971 |
|
|
74 |
Udamalpet ... ... |
10,236 |
5,000 |
1 |
242 |
171 |
413 |
413 |
405 |
249 |
|
|
75 |
Vāniyambādi ... ... |
20,090 |
5,740 |
1 |
181 |
201 |
382 |
382 |
393 |
318 |
|
|
76 |
Vellore ... ... ... |
50,210 |
12,553 |
2 |
1,310 |
831 |
2,141 |
1,071 |
1,687 |
1,384 |
|
|
77 |
Villupuram ... ... |
17,423 |
4,311 |
1 |
379 |
270 |
619 |
649 |
496 |
343 |
|
|
78 |
Virudhunagar ... ... |
21,821 |
9,698 |
1 |
483 |
358 |
841 |
841 |
708 |
547 |
|
|
79 |
Vizagapatam ... ... |
45,018 |
8,657 |
2 |
661 |
705 |
1,366 |
683 |
1,374 |
906 |
|
|
80 |
Vizianagram ... ... |
39,328 |
7,866 |
2 |
1,147 |
1,028 |
2,175 |
1,088 |
2,111 |
1,376 |
|
|
81 |
Walajapet ... ... |
10,013 |
10,013 |
1 |
265 |
173 |
438 |
438 |
307 |
251 |
|
|
Total of Municipalities. |
3,028,844 |
... |
174 |
107,058 |
73,381 |
180,439 |
1,037 |
118,552 |
76,196 |
||
|
1 |
Military |
Bangalore ... ... |
118,940 |
8,792 |
2 |
1,402 |
974 |
2,376 |
1,188 |
406 |
207 |
|
2 |
Secunderabad ... ... |
95,124 |
5,006 |
6 |
5,004 |
7,387 |
12,391 |
2,065 |
5,913 |
3,686 |
|
|
Total of Cantonments ... |
214,064 |
6,899 |
8 |
6,406 |
8,361 |
14,767 |
1,846 |
6,319 |
3,893 |
||
|
Total of Medical Sub- |
... |
... |
... |
17,973 |
251 |
18,224 |
... |
1,188 |
97 |
||
|
Grand Total |
* 42,227,551 |
... |
720 |
953,501 |
805,126 |
1,758,627 |
† 2,441 |
1,565,538 |
572,830 |
||
* Excluding the populations of Bangalore and Secunderabad cantonments.
† In finding out the average number of persons vaccinated the total work of Medical Subordinates is excluded.
‡ Excluding the cantonments of Bangalore and Secunderabad.
NOTE.—(1) Difference between number of operations and number of persons vaccinated equals 153,741 which represents
secondary operations.
(2) This statement does not include the statistics of dispensary vaccination which are exhibited separately in
Statement No. III.
N.B.—In calculating the percentage of success shown in this statement and Statement No. III unknown cases have not
been taken into account.
Set display mode to: Large image | Zoom image | Transcription
Images and transcriptions on this page, including medium image downloads, may be used under the Creative Commons Attribution 4.0 International Licence unless otherwise stated. ![]()
| Permanent URL | https://digital.nls.uk/91180226 |
|---|
| Attribution and copyright: |
|
|---|


