Medicine - Vaccination > 1899-1928 - Report on vaccination in the Bombay Presidency > Vaccination in Bombay 1924-1928 > 1923-1924 - Notes on vaccination in the Bombay Presidency for the year 1923-24
(75) Page 67
Download files
Individual page:
Thumbnail gallery: Grid view | List view

67
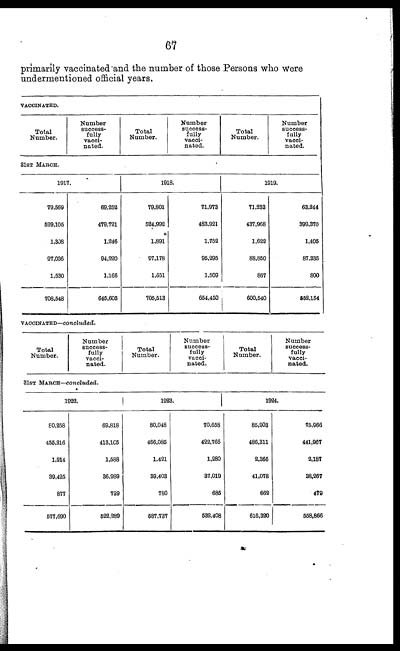
primarily vaccinated and the number of those Persons who were
undermentioned official years.
|
VACCINATED. |
|||||
|
Total |
Number |
Total |
Number |
Total |
Number |
|
31ST MARCH. |
|||||
|
1917. |
1918. |
1919. |
|||
|
79,569 |
69,252 |
79,801 |
71,973 |
71,233 |
63,244 |
|
529,105 |
479,721 |
524,992 |
483,921 |
437,968 |
399,370 |
|
1,308 |
1,246 |
1,891 |
1,752 |
1,622 |
1,405 |
|
97,036 |
94,220 |
97,178 |
95,295 |
88,850 |
87,335 |
|
1,530 |
1,166 |
1,651 |
1,509 |
867 |
800 |
|
708,548 |
645,605 |
705,513 |
654,450 |
600,540 |
552,154 |
|
VACCINATED—concluded. |
|||||
|
Total |
Number |
Total |
Number |
Total |
Number |
|
31ST MARCH—concluded. |
|||||
|
1922. |
1923. |
1924. |
|||
|
80,258 |
69,818 |
80,048 |
70,658 |
85,903 |
75,966 |
|
455,216 |
413,105 |
466,085 |
422,766 |
486,311 |
441,967 |
|
1,914 |
1,588 |
1,421 |
1,280 |
2,366 |
2,187 |
|
39,425 |
36,989 |
39,403 |
37,019 |
41,078 |
38,267 |
|
877 |
729 |
780 |
685 |
662 |
479 |
|
577,690 |
522,289 |
587,737 |
532,408 |
616,320 |
558,866 |
Set display mode to: Large image | Zoom image | Transcription
Images and transcriptions on this page, including medium image downloads, may be used under the Creative Commons Attribution 4.0 International Licence unless otherwise stated. ![]()
| Permanent URL | https://digital.nls.uk/91047719 |
|---|
| Attribution and copyright: |
|
|---|


