Medicine - Vaccination > 1899-1928 - Report on vaccination in the Bombay Presidency > Vaccination in Bombay 1924-1928 > 1923-1924 - Notes on vaccination in the Bombay Presidency for the year 1923-24
(74) Page 66
Download files
Individual page:
Thumbnail gallery: Grid view | List view

66
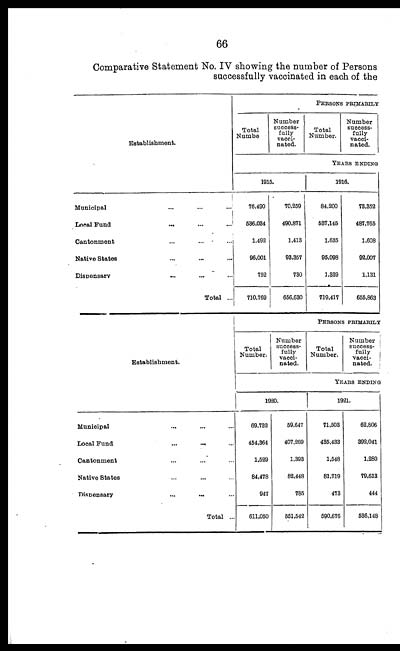
Comparative Statement No. IV showing the number of Persons
successfully vaccinated in each of the
|
Establishment. |
PERSONS PRIMARILY |
|||
|
Total |
Number |
Total |
Number |
|
|
YEARS ENDING |
||||
|
1915. |
1916. |
|||
|
Municipal ... ... ... |
76,490 |
70,259 |
84,200 |
73,352 |
|
Local Fund ... ... ... |
536,034 |
490,871 |
537,145 |
487,765 |
|
Cantonment ... ... ... |
1,492 |
1,413 |
1,635 |
1,608 |
|
Native States ... ... ... |
96,001 |
93,357 |
95,098 |
92,007 |
|
Dispensary ... ... ... |
752 |
730 |
1,339 |
1,131 |
|
Total ... |
710,769 |
656,630 |
719,417 |
655,863 |
|
Establishment. |
PERSONS PRIMARILY |
|||
|
Total |
Number |
Total |
Number |
|
|
YEARS ENDING |
||||
|
1920. |
1921. |
|||
|
Municipal ... ... ... |
69,732 |
59,647 |
71,503 |
62,806 |
|
Local Fund ... ... ... |
454,364 |
407,269 |
435,433 |
392,041 |
|
Cantonment ... ... ... |
1,529 |
1,393 |
1,548 |
1,280 |
|
Native States ... ... ... |
84,478 |
82,448 |
81,719 |
79,613 |
|
Dispensary ... ... ... |
947 |
785 |
473 |
444 |
|
Total ... |
611,050 |
551,542 |
590,676 |
536,148 |
Set display mode to: Large image | Zoom image | Transcription
Images and transcriptions on this page, including medium image downloads, may be used under the Creative Commons Attribution 4.0 International Licence unless otherwise stated. ![]()
| Permanent URL | https://digital.nls.uk/91047716 |
|---|
| Attribution and copyright: |
|
|---|


