

Medicine - Vaccination > 1902-1928 - Report on vaccination in the United Provinces > Vaccination United Provinces of Agra and Oudh 1923-1928 > Notes on vaccination in the United Provinces of Agra and Oudh for the year ending 31st March, 1925
(122) Page 2
![[Page 1]](https://deriv.nls.uk/dcn4/9051/90513164.4.jpg)
Download files
Individual page:
Thumbnail gallery: Grid view | List view
( 2 )
Expenditure on vacci-
nation.
(Statement II.)
4. There was an increase of Rs. 11,032 in the total expenditure,
excluding the charges on account of the Assistants
Directors of Public Health and their establishments
and a decrease of Rs. 1,096, including these charges
as compared with 1923-24, the total during the two
years being Rs. 3,98,376 and Rs. 3,87,344 and Rs. 4,61,492 and Rs. 4,62,588,
respectively. The increase is due to the increased expenditure under the
Government Bovine Lymph Dépôt, Patwa Dangar, and the vaccination
staff. The decrease in expenditure under Assistant Directors of Public
Health is due to the fact that the Assistant Directors of Public Health, 2nd
and 3rd Ranges, were on leave ex-India for about six months.
Average cost of each
successful case of
vaccination.
(Statement II.)
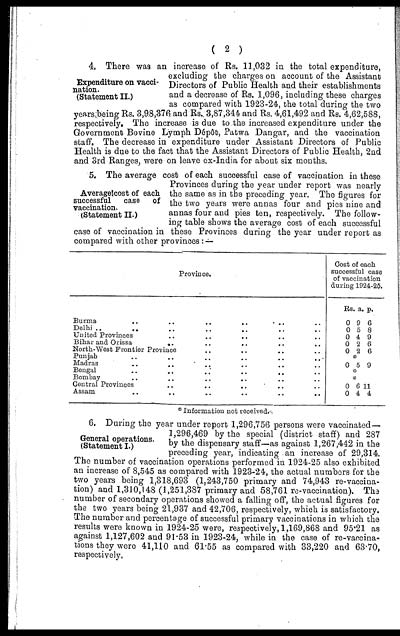
5. The average cost of each successful case of vaccination in these
Provinces during the year under report was nearly
the same as in the preceding year. The figures for
the two years were annas four and pies nine and
annas four and pies ten, respectively. The follow-
ing table shows the average cost of each successful
case of vaccination in these Provinces during the year under report as
compared with other provinces : —
|
Province. |
Cost of each |
||
|
Rs. |
a. |
p. |
|
|
Burma .. .. .. .. |
0 |
9 |
6 |
|
Delhi .. .. .. |
0 |
5 |
8 |
|
United Provinces .. .. .. |
0 |
4 |
9 |
|
Bihar and Orissa .. .. .. |
0 |
2 |
6 |
|
North-West Frontier Province |
0 |
2 |
6 |
|
Punjab .. .. .. |
* |
||
|
Madras .. .. .. |
0 |
5 |
9 |
|
Bengal .. .. .. |
* |
||
|
Bombay .. .. .. |
* |
||
|
Central Provinces .. .. .. |
0 |
6 |
11 |
|
Assam .. .. .. |
0 |
4 |
4 |
* Information not received.
General operations.
(Statement I.)
6. During the year under report 1,296,756 persons were vaccinated—
1,296,469 by the special (district staff) and 287
by the dispensary staff—as against 1,267,442 in the
preceding year, indicating an increase of 29,314.
The number of vaccination operations performed in 1924-25 also exhibited
an increase of 8,545 as compared with 1923-24, the actual numbers for the
two years being 1,318,693 (1,243,750 primary and 74,943 re-vaccina-
tion) and 1,310,148 (1,251,387 primary and 58,761 re-vaccination). The
number of secondary operations showed a falling off, the actual figures for
the two years being 21,937 and 42,706, respectively, which is satisfactory.
The number and percentage of successful primary vaccinations in which the
results were known in 1924-25 were, respectively, 1,169,868 and 95.21 as
against 1,127,602 and 91.53 in 1923-24, while in the case of re-vaccina-
tions they were 41,110 and 61.55 as compared with 33,220 and 63.70,
respectively,
Set display mode to: Large image | Zoom image | Transcription
Images and transcriptions on this page, including medium image downloads, may be used under the Creative Commons Attribution 4.0 International Licence unless otherwise stated. ![]()
| Permanent URL | https://digital.nls.uk/90513165 |
|---|
| Attribution and copyright: |
|
|---|
| Description | Covers 1902-1928. Details and appraises vaccination operations in the United Provinces of Agra and Oudh. Describes manufacture and storage of lymph. Tables show particulars of vaccination. Success and mortality rates noted. Colour diagrams included. |
|---|---|
| Shelfmark | IP/30/VA.3 |
| Additional NLS resources: | |
| Description | The Vaccination collection consists of 66 volumes dating from 1856 to 1933. Reports show how vaccination against smallpox was implemented in India. They reveal the shift from variolation, improved vaccination techniques, logistics of lymph supply, funding and staffing. They explore how the local population viewed and resisted western vaccination. |
|---|---|
| Description | The India Papers collection contains publications of the central (Imperial) Government and many Indian states. Most states came under British rule. Much of the collection dates from between the post-Mutiny re-organisation of the Indian Government and Indian Independence in 1947. Some items published in London by John Murray. |
|---|---|
| Shelfmark | India Papers |
| Additional NLS resources: | |