

Medicine - Vaccination > 1902-1928 - Report on vaccination in the United Provinces > Vaccination United Provinces of Agra and Oudh 1914-1922 > 1914-1917 - Triennial report on vaccination in the United Provinces of Agra and Oudh for the years 1914-15, 1915-16 and 1916-17
(150) Page 3
Download files
Individual page:
Thumbnail gallery: Grid view | List view
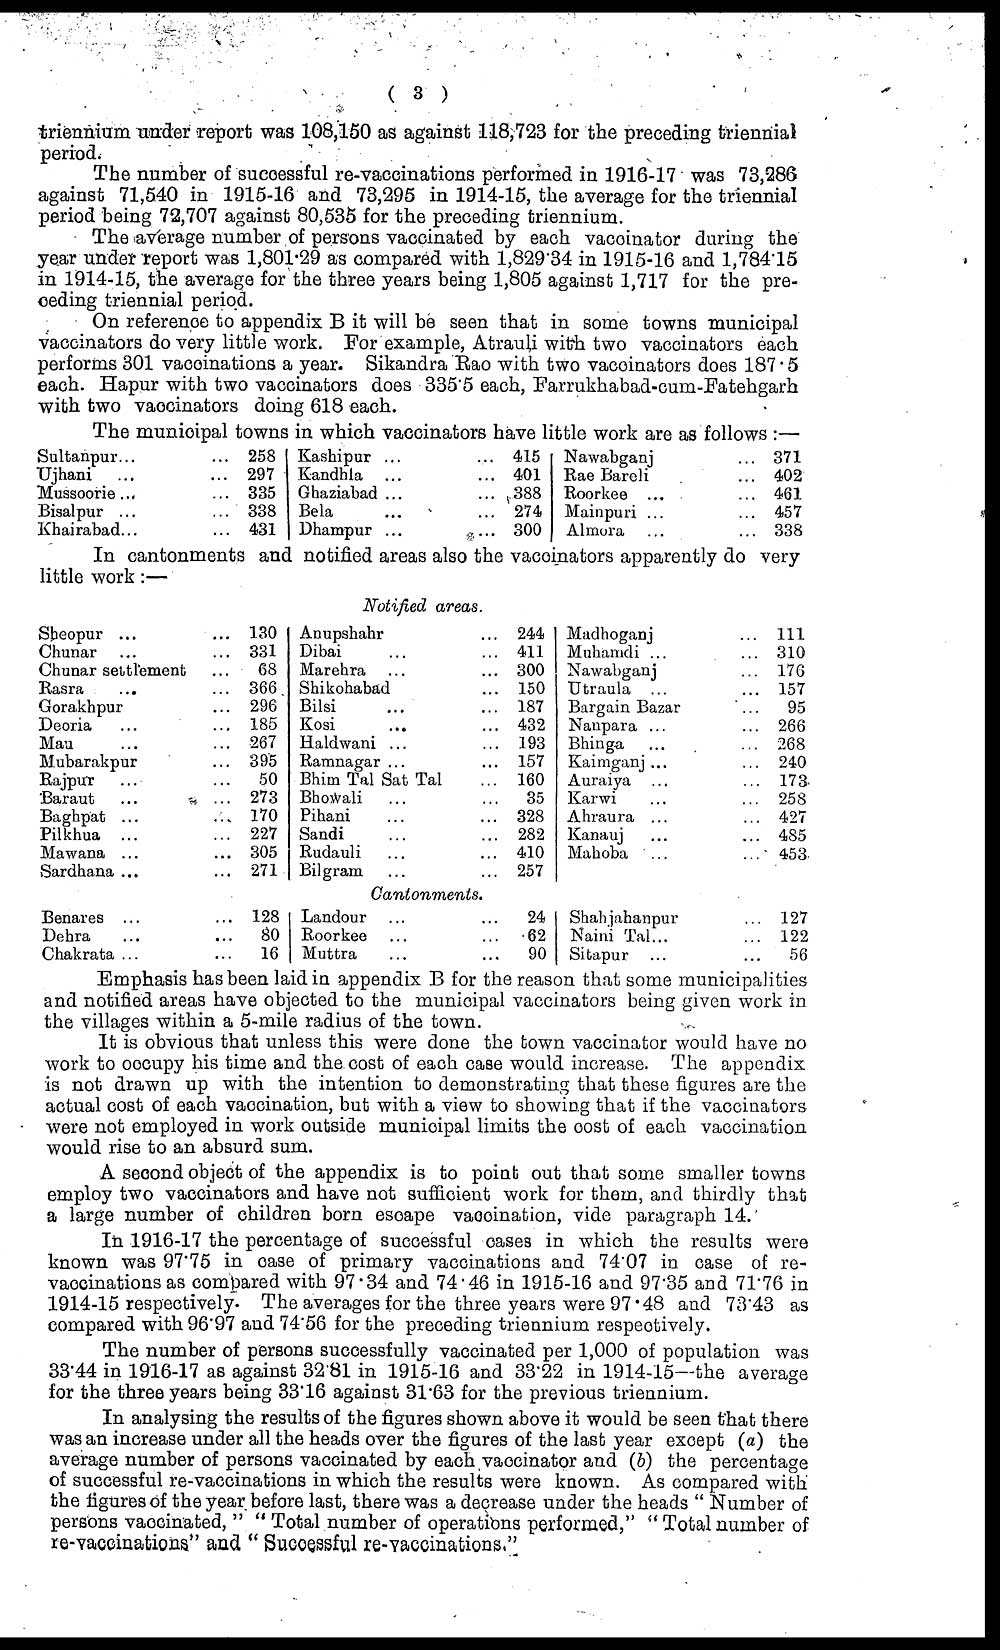
( 3 )
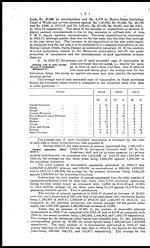
triennium under report was 108.150 as against 118,723 for the preceding triennial
period.
The number of successful re-vaccinations performed in 1916-17 was 73,286
against 71,540 in 1915-16 and 73,295 in 1914-15, the average for the triennial
period being 72,707 against 80,535 for the preceding triennium.
The average number of persons vaccinated by each vaccinator during the
year under report was 1,801.29 as compared with 1,829.34 in 1915-16 and 1,784.15
in 1914-15, the average for the three years being 1,805 against 1,717 for the pre-
ceding triennial period.
On reference to appendix B it will be seen that in some towns municipal
vaccinators do very little work. For example, Atrauli with two vaccinators each
performs 301 vaccinations a year. Sikandra Rao with two vaccinators does 187.5
each. Hapur with two vaccinators does 335.5 each, Farrukhabad-cum-Fatehgarh
with two vaccinators doing 618 each.
The municipal towns in which vaccinators have little work are as follows :—
|
Sultanpur... ... |
258 |
Kashipur ... ... |
415 |
Nawabganj ... |
371 |
|
Ujhani ... ... |
297 |
Kandhla ... ... |
401 |
Rae Bareli ... |
402 |
|
Mussoorie ... ... |
335 |
Ghaziabad ... ... |
388 |
Roorkee ... ... |
461 |
|
Bisalpur ... ... |
338 |
Bela ... ... |
274 |
Mainpuri ... ... |
457 |
|
Khairabad... ... |
431 |
Dhampur ... ... |
300 |
Almora ... ... |
338 |
In cantonments and notified areas also the vaccinators apparently do very
little work:—
|
Notified areas. |
|||||
|
Sheopur ... ... |
130 |
Anupshahr ... |
244 |
Madhoganj ... |
111 |
|
Chunar ... ... |
331 |
Dibai ... ... |
411 |
Muhamdi ... ... |
310 |
|
Chunar settlement ... |
68 |
Marehra ... ... |
300 |
Nawabganj ... |
176 |
|
Rasra ... ... |
366 |
Shikohabad ... |
150 |
Utraula ... ... |
157 |
|
Gorakhpur ... |
296 |
Bilsi ... ... |
187 |
Bargain Bazar ... |
95 |
|
Deoria ... ... |
185 |
Kosi ... ... |
432 |
Nanpara ... ... |
266 |
|
Mau ... ... |
267 |
Haldwani ... ... |
193 |
Bhinga ... ... |
268 |
|
Mubarakpur ... |
395 |
Ramnagar ... ... |
157 |
Kaimganj ... ... |
240 |
|
Rajput ... ... |
50 |
Bhim Tal Sat Tal ... |
160 |
Auraiya ... ... |
173 |
|
Baraut ... ... |
273 |
Bhowali ... ... |
35 |
Karwi ... ... |
258 |
|
Baghpat ... ... |
170 |
Pihani ... ... |
328 |
Ahraura ... ... |
427 |
|
Pilkhua ... ... |
227 |
Sandi ... ... |
282 |
Kanauj ... ... |
485 |
|
Mawana ... ... |
305 |
Rudauli ... ... |
410 |
Mahoba ... ... |
453 |
|
Sardhana ... ... |
271 |
Bilgram ... ... |
257 |
||
|
Cantonments. |
|||||
|
Benares ... ... |
128 |
Landour ... ... |
24 |
Shahjahanpur ... |
127 |
|
Dehra ... ... |
80 |
Roorkee ... ... |
62 |
Naini Tal... ... |
122 |
|
Chakrata ... ... |
16 |
Muttra ... ... |
90 |
Sitapur ... ... |
56 |
Emphasis has been laid in appendix B for the reason that some municipalities
and notified areas have objected to the municipal vaccinators being given work in
the villages within a 5-mile radius of the town.
It is obvious that unless this were done the town vaccinator would have no
work to occupy his time and the cost of each case would increase. The appendix
is not drawn up with the intention to demonstrating that these figures are the
actual cost of each vaccination, but with a view to showing that if the vaccinators
were not employed in work outside municipal limits the cost of each vaccination
would rise to an absurd sum.
A second object of the appendix is to point out that some smaller towns
employ two vaccinators and have not sufficient work for them, and thirdly that
a large number of children born escape vaccination, vide paragraph 14.
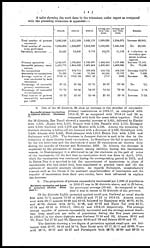
In 1916-17 the percentage of successful cases in which the results were
known was 97.75 in case of primary vaccinations and 74.07 in case of re-
vaccinations as compared with 97.34 and 74.46 in 1915-16 and 97.35 and 71.76 in
1914-15 respectively. The averages for the three years were 97.48 and 73.43 as
compared with 96.97 and 74.56 for the preceding triennium respectively.
The number of persons successfully vaccinated per 1,000 of population was
33.44 in 1916-17 as against 32.81 in 1915-16 and 33.22 in 1914-15—the average
for the three years being 33.16 against 31.63 for the previous triennium.
In analysing the results of the figures shown above it would be seen that there
was an increase under all the heads over the figures of the last year except (a) the
average number of persons vaccinated by each vaccinator and (b) the percentage
of successful re-vaccinations in which the results were known. As compared with
the figures of the year before last, there was a decrease under the heads " Number of
persons vaccinated, " " Total number of operations performed," " Total number of
re-vaccinations" and " Successful re-vaccinations."
Set display mode to: Large image | Zoom image | Transcription
Images and transcriptions on this page, including medium image downloads, may be used under the Creative Commons Attribution 4.0 International Licence unless otherwise stated. ![]()
| Permanent URL | https://digital.nls.uk/90473184 |
|---|
| Attribution and copyright: |
|
|---|
| Description | Covers 1902-1928. Details and appraises vaccination operations in the United Provinces of Agra and Oudh. Describes manufacture and storage of lymph. Tables show particulars of vaccination. Success and mortality rates noted. Colour diagrams included. |
|---|---|
| Shelfmark | IP/30/VA.3 |
| Additional NLS resources: | |
| Description | The Vaccination collection consists of 66 volumes dating from 1856 to 1933. Reports show how vaccination against smallpox was implemented in India. They reveal the shift from variolation, improved vaccination techniques, logistics of lymph supply, funding and staffing. They explore how the local population viewed and resisted western vaccination. |
|---|---|
| Description | The India Papers collection contains publications of the central (Imperial) Government and many Indian states. Most states came under British rule. Much of the collection dates from between the post-Mutiny re-organisation of the Indian Government and Indian Independence in 1947. Some items published in London by John Murray. |
|---|---|
| Shelfmark | India Papers |
| Additional NLS resources: | |