

Medicine - Vaccination > 1866-1901 - Annual report upon vaccination in the North-Western Provinces > Vaccination North-Western Provinces and Oudh 1896-1901 > Annual report on vaccination in the North-Western Provinces and Oudh for the year 1899-1900
(278) Page 2
![[Page 1]](https://deriv.nls.uk/dcn4/8722/87229612.4.jpg)
Download files
Individual page:
Thumbnail gallery: Grid view | List view
( 2 )
Increase is noticeable under each head of expenditure. The large increase of
Rs. 5,889-15-11 under the heading "pay of establishment" is due to the presence
of both the Deputy Sanitary Commissioners throughout the season, while in 1898-
99 one Deputy Sanitary Commissioner was on furlough.
Average cost of each successful case
of vaccination.
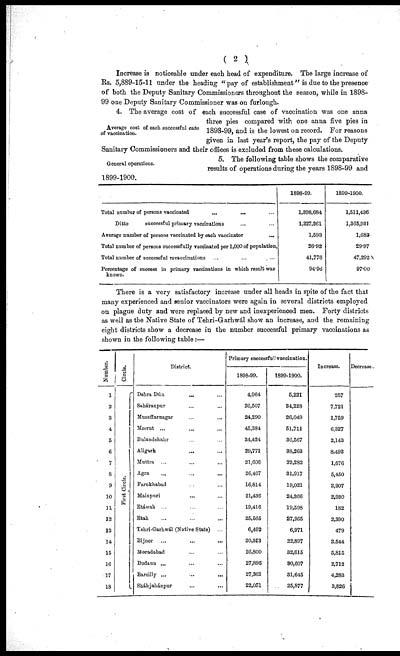
4. The average cost of each successful case of vaccination was one anna
three pies compared with one anna five pies in
1898-99, and is the lowest on record. For reasons
given in last year's report, the pay of the Deputy
Sanitary Commissioners and their offices is excluded from these calculations.
General operations.
5. The following table shows the comparative
results of operations during the years 1898-99 and
1899-1900.
|
1898-99. |
1899-1900. |
|
|
Total number of persons vaccinated ... ... ... |
1,398,684 |
1,511,436 |
|
Ditto successful primary vaccinations ... ... |
1,227,261 |
1,365,931 |
|
Average number of persons vaccinated by each vaccinator ... |
1,593 |
1,683 |
|
Total number of persons successfully vaccinated per 1,000 of population, |
26.92 |
29.97 |
|
Total number of successful revaccinations ... ... ... |
41,776 |
47,292 |
|
Percentage of success in primary vaccinations in which result was |
94.96 |
97.00 |
There is a very satisfactory increase under all heads in spite of the fact that
many experienced and senior vaccinators were again in several districts employed
on plague duty and were replaced by new and inexperienced men. Forty districts
as well as the Native State of Tehri-Garhwál show an increase, and the remaining
eight districts show a decrease in the number successful primary vaccinations as
shown in the following table :—
|
Number. |
Circle. |
District. |
Primary successfull vaccination. |
Increase. |
Decrease |
|
|
1898-99. |
1899-1900. |
|||||
|
1 |
First Circle. |
Dehra Dún ... ... |
4,964 |
5,221 |
257 |
|
|
2 |
Saháranpur ... ... |
26,507 |
34,228 |
7,721 |
||
|
3 |
Muzaffarnagar ... ... |
24,290 |
26,049 |
1,759 |
||
|
4 |
Meerut ... ... ... |
45,381 |
51,711 |
6,327 |
||
|
5 |
Bulandshahr ... ... |
34,424 |
36,567 |
2,143 |
||
|
6 |
Aligarh ... ... |
29,771 |
38,263 |
8,492 |
||
|
7 |
Muttra ... ... ... |
21,606 |
23,282 |
1,676 |
||
|
8 |
Agra ... ... ... |
26,467 |
31,917 |
5,450 |
||
|
9 |
Farukhabad ... ... |
16,814 |
19,021 |
2,207 |
||
|
10 |
Mainpuri ... ... |
21,456 |
24,366 |
2,930 |
||
|
11 |
Etáwah ... ... ... |
19,416 |
19,598 |
182 |
||
|
12 |
Etah ... ... ... |
25,565 |
27,955 |
2,390 |
||
|
13 |
Tehri-Garhwal (Native State) ... |
6,492 |
6,971 |
479 |
||
|
14 |
Bijnor ... ... ... |
20,353 |
22,897 |
2,544 |
||
|
15 |
Moradabad ... ... |
26,800 |
32,615 |
5,815 |
||
|
16 |
Budaun ... ... ... |
27,895 |
30,607 |
2,712 |
||
|
17 |
Bareilly ... ... ... |
27,362 |
31,645 |
4,283 |
||
|
18 |
Sháhjahánpur ... ... |
22,051 |
25,877 |
3,826 |
||
Set display mode to: Large image | Zoom image | Transcription
Images and transcriptions on this page, including medium image downloads, may be used under the Creative Commons Attribution 4.0 International Licence unless otherwise stated. ![]()
| Permanent URL | https://digital.nls.uk/87229613 |
|---|
| Attribution and copyright: |
|
|---|
| Description | Covers 1866-1901. Appraises vaccination operations in North-Western Provinces and Oudh. Describes transition from smallpox vaccination with crusts to arm-to-arm vaccination. Lymph extracted from children replaced with animal and lanolin lymph from c.1869. Explores native objections. Tables show particulars of vaccination. Success and mortality rates noted. Colour maps and diagrams included. |
|---|---|
| Shelfmark | IP/30/VA.3 |
| Additional NLS resources: | |
| Description | The Vaccination collection consists of 66 volumes dating from 1856 to 1933. Reports show how vaccination against smallpox was implemented in India. They reveal the shift from variolation, improved vaccination techniques, logistics of lymph supply, funding and staffing. They explore how the local population viewed and resisted western vaccination. |
|---|---|
| Description | The India Papers collection contains publications of the central (Imperial) Government and many Indian states. Most states came under British rule. Much of the collection dates from between the post-Mutiny re-organisation of the Indian Government and Indian Independence in 1947. Some items published in London by John Murray. |
|---|---|
| Shelfmark | India Papers |
| Additional NLS resources: | |