

Medicine - Vaccination > 1866-1901 - Annual report upon vaccination in the North-Western Provinces > Vaccination North-Western Provinces and Oudh 1878-1895 > 1892-1893 - Annual report on vaccination in the North-Western Provinces and Oudh for the year 1892-93
(231) Page 8
Download files
Individual page:
Thumbnail gallery: Grid view | List view
( 8 )
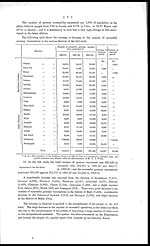
The number of persons successfully, vaccinated per 1,000 of population in the
plains districts ranged from 12.29 in Basti, and 12.65 in Azamgarh to 26.20 in Jalaun
and 27.73 in Jhánsi.
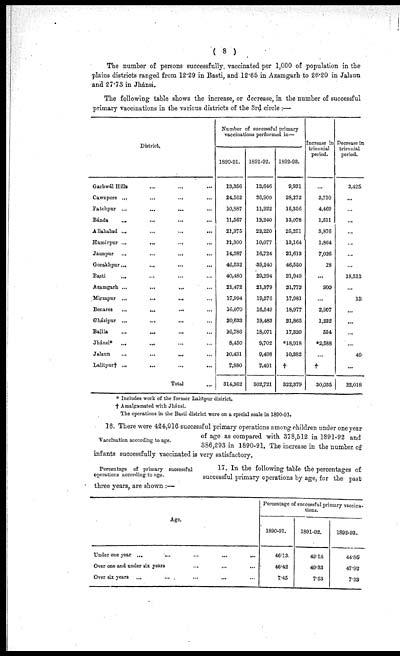
The following table shows the increase, or decrease, in the number of successful
primary vaccinations in the various districts of the 3rd circle :—
|
District. |
Number of successful primary |
Increase in |
Decrease in |
||
|
1890-91. |
1891-92. |
1892-93. |
|||
|
Garhwál Hills ... ... ... ... |
13,356 |
12,646 |
9,931 |
... |
3,425 |
|
Cawnpore ... ... ... ... |
24,562 |
26,909 |
28,272 |
3,710 |
... |
|
Fatehpur ... ... ... ... |
10,887 |
11,922 |
15,356 |
4,469 |
... |
|
Bánda ... ... ... ... |
11,567 |
12,240 |
13,078 |
1,511 |
... |
|
Allahabad ... ... ... ... |
21,375 |
22,220 |
25,251 |
3,876 |
... |
|
Hamirpur ... ... ... ... |
11,300 |
10,077 |
13,164 |
1,864 |
... |
|
Jaunpur ... ... ... ... |
14,387 |
16,724 |
21,613 |
7,026 |
... |
|
Gorakhpur ... ... ... ... |
46,532 |
39,240 |
46,550 |
18 |
... |
|
Basti ... ... ... ... |
40,480 |
29,294 |
21,949 |
... |
18,532 |
|
Azamgarh ... ... ... ... |
21,472 |
21,379 |
21,772 |
300 |
... |
|
Mirzapur ... ... ... ... |
17,994 |
19,276 |
17,981 |
... |
13 |
|
Benares ... ... ... ... |
16,070 |
16,549 |
18,977 |
2,907 |
... |
|
Cházipur ... ... ... ... |
20,633 |
19,483 |
21,865 |
1,232 |
... |
|
Ballia ... ... ... ... |
16,786 |
18,071 |
17,320 |
534 |
... |
|
Jhánsi* ... ... ... ... |
8,450 |
9,702 |
*18,918 |
*2,588 |
... |
|
Jalaun ... ... ... |
10,431 |
9,498 |
10,382 |
... |
49 |
|
Lalitpur† ... ... ... ... |
7,880 |
7,491 |
† |
† |
... |
|
Total ... |
314,362 |
302,721 |
322,379 |
30,035 |
22,018 |
* Includes work of the former Lalitpur disirict,
† Amalgamated with Jhánsi.
The operations in the Basti district were on a special scale in 1890-91.
Vaccination according to age.
16. There were 424,016 successful primary operations among children under one year
of age as compared with 378,512 in 1891-92 and
386,293 in 1890-91. The increase in the number of
infants successfully vaccinated is very satisfactory.
Percentage of primary successful
operations according to age.
17. In the following table the percentages of
successful primary operations by age, for the past
three years, are shown :—
|
Percentage of successful primary vaccina- |
|||
|
Age. |
1890-91. |
1891 92. |
1892-93. |
|
Under one year ... ... ... ... ... |
46.13 |
43.14 |
44.85 |
|
Over one and under six years ... ... ... |
46.42 |
49.33 |
47.93 |
|
Over six years ... ... ... ... ... |
7.45 |
7.53 |
7.23 |
Set display mode to: Large image | Zoom image | Transcription
Images and transcriptions on this page, including medium image downloads, may be used under the Creative Commons Attribution 4.0 International Licence unless otherwise stated. ![]()
| Permanent URL | https://digital.nls.uk/87227038 |
|---|
| Attribution and copyright: |
|
|---|
| Description | Covers 1866-1901. Appraises vaccination operations in North-Western Provinces and Oudh. Describes transition from smallpox vaccination with crusts to arm-to-arm vaccination. Lymph extracted from children replaced with animal and lanolin lymph from c.1869. Explores native objections. Tables show particulars of vaccination. Success and mortality rates noted. Colour maps and diagrams included. |
|---|---|
| Shelfmark | IP/30/VA.3 |
| Additional NLS resources: | |
| Description | The Vaccination collection consists of 66 volumes dating from 1856 to 1933. Reports show how vaccination against smallpox was implemented in India. They reveal the shift from variolation, improved vaccination techniques, logistics of lymph supply, funding and staffing. They explore how the local population viewed and resisted western vaccination. |
|---|---|
| Description | The India Papers collection contains publications of the central (Imperial) Government and many Indian states. Most states came under British rule. Much of the collection dates from between the post-Mutiny re-organisation of the Indian Government and Indian Independence in 1947. Some items published in London by John Murray. |
|---|---|
| Shelfmark | India Papers |
| Additional NLS resources: | |