Medicine - Vaccination > 1867-1929 - Report on vaccination in the Punjab > Vaccination in the Punjab 1919-1929 > 1921-1922 - Notes on vaccination in the Punjab for the year 1921-22
(132) Page iii
Download files
Individual page:
Thumbnail gallery: Grid view | List view

iii
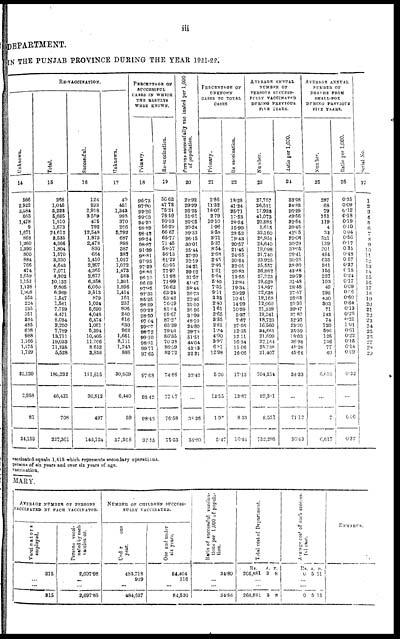
DEPARTMENT.
IN THE PUNJAB PROVINCE DURING THE YEAR 1921-22.
|
RE-VACCINATION |
PERCENTAGE OF |
Persons successfully vaccinated per 1,000 |
PERCENTAGE OF |
AVERAGE ANNUAL |
AVERAGE ANNUAL |
serial No. |
|||||||
|
Unknown. |
Total. |
Successful. |
Unknown. |
||||||||||
|
Primary. |
Re-vaccination. |
Primary. |
Re-vaccination. |
Number. |
Ratio per 1,000. |
Number. |
Ratio per 1,000. |
||||||
|
14 |
15 |
16 |
17 |
18 |
19 |
20 |
21 |
22 |
23 |
24 |
25 |
26 |
27 |
|
566 |
268 |
124 |
49 |
96.72 |
56.62 |
22.92 |
2.86 |
18.28 |
27,757 |
33.98 |
287 |
0.35 |
1 |
|
2,922 |
1,045 |
293 |
431 |
97.90 |
47.72 |
29.39 |
11.32 |
41.24 |
26,511 |
34.33 |
68 |
0.09 |
2 |
|
3,584 |
5,223 |
2,918 |
1,343 |
92.26 |
75.21 |
26.25 |
18.07 |
25.71 |
17,933 |
26.29 |
79 |
0.12 |
3 |
|
663 |
5,635 |
3,559 |
988 |
99.03 |
76.59 |
31.91 |
2.79 |
17.53 |
41,073 |
49.56 |
151 |
0.18 |
4 |
|
1,478 |
1,310 |
475 |
370 |
94.20 |
50.53 |
20.05 |
10.10 |
28.24 |
20,885 |
32.54 |
119 |
0.19 |
5 |
|
9 |
1,673 |
792 |
266 |
98.89 |
56.29 |
30.24 |
1.96 |
15.90 |
1,615 |
39.45 |
4 |
0.10 |
6 |
|
1,671 |
24,612 |
12,548 |
5,792 |
98.42 |
66.67 |
39.33 |
8.58 |
23.53 |
32,160 |
42.05 |
32 |
0.04 |
7 |
|
868 |
3,535 |
1,873 |
687 |
99.24 |
65.77 |
26.15 |
3.71 |
19.43 |
26,951 |
20.06 |
521 |
0.56 |
8 |
|
1,260 |
4,366 |
2,478 |
898 |
98.87 |
71.45 |
30.01 |
5.37 |
20.57 |
24,640 |
30.29 |
139 |
0.17 |
9 |
|
1,390 |
1,804 |
830 |
387 |
91.39 |
58.57 |
25.44 |
8.54 |
21.45 |
19,098 |
33.65 |
201 |
0.35 |
10 |
|
800 |
1,570 |
664 |
387 |
98.81 |
56.13 |
27.20 |
2.68 |
24.65 |
31,740 |
29.41 |
484 |
0.48 |
11 |
|
884 |
3,330 |
1,410 |
1,027 |
97.95 |
61.22 |
32.19 |
2.45 |
30.84 |
33,925 |
30.38 |
635 |
0.57 |
12 |
|
766 |
4,643 |
2,207 |
1,022 |
97.39 |
60.95 |
34.21 |
2.46 |
22.01 |
35,557 |
38.30 |
341 |
0.37 |
13 |
|
474 |
7,071 |
4,365 |
1,473 |
98.86 |
77.97 |
39.02 |
1.61 |
20.83 |
36,862 |
43.48 |
156 |
0.18 |
14 |
|
1,659 |
4,302 |
2,677 |
583 |
96.10 |
71.98 |
31.52 |
5.64 |
13.55 |
27,723 |
29.79 |
227 |
0.24 |
15 |
|
1,152 |
10,133 |
6,358 |
1,301 |
96.69 |
71.99 |
41.47 |
5.40 |
12.84 |
19,629 |
31.48 |
103 |
0.17 |
16 |
|
1,138 |
9,805 |
6,060 |
1,896 |
97.85 |
76.62 |
38.44 |
7.35 |
19.34 |
14,897 |
28.48 |
49 |
0.09 |
17 |
|
1,908 |
6,969 |
3,513 |
1,414 |
97.33 |
63.24 |
26.73 |
9.11 |
20.29 |
22,638 |
27.47 |
298 |
0.86 |
18 |
|
553 |
1,547 |
879 |
161 |
95.25 |
63.42 |
22.46 |
3.33 |
10.41 |
19,168 |
26.63 |
450 |
0.60 |
19 |
|
224 |
1,581 |
1,024 |
237 |
98.89 |
76.19 |
21.10 |
2.40 |
14.99 |
12,060 |
25.36 |
303 |
0.64 |
20 |
|
235 |
7,759 |
5,690 |
806 |
99.22 |
81.84 |
36.96 |
1.61 |
10.39 |
21,339 |
39.47 |
71 |
0.13 |
21 |
|
351 |
4,471 |
4,048 |
240 |
98.50 |
86.67 |
32.99 |
2.65 |
5.37 |
19,241 |
37.87 |
143 |
0.28 |
22 |
|
384 |
8,034 |
6,474 |
616 |
97.04 |
87.27 |
48.10 |
3.35 |
7.67 |
18,723 |
52.27 |
74 |
0.21 |
23 |
|
485 |
2,250 |
1,061 |
630 |
99.07 |
65.39 |
24.80 |
2.81 |
27.56 |
16,560 |
23.20 |
720 |
1.01 |
24 |
|
638 |
7,789 |
5,394 |
962 |
98.72 |
79.01 |
39.73 |
1.84 |
12.35 |
34,661 |
35.39 |
596 |
0.61 |
25 |
|
988 |
13,711 |
10,405 |
1,661 |
99.10 |
86.35 |
51.51 |
4.90 |
12.11 |
21,699 |
38.03 |
126 |
0.22 |
26 |
|
1,166 |
19,033 |
11,206 |
3,111 |
98.31 |
70.38 |
44.04 |
3.97 |
16.34 |
32,164 |
36.38 |
136 |
0.15 |
27 |
|
1,175 |
11,235 |
8,652 |
1,243 |
99.71 |
86.59 |
43.13 |
6.81 |
11.06 |
25,738 |
45.28 |
77 |
0.14 |
28 |
|
1,729 |
5,528 |
3,838 |
888 |
97.65 |
82.72 |
32.31 |
12.98 |
16.06 |
21,407 |
45.64 |
40 |
0.09 |
29 |
|
31,120 |
180,232 |
111,815 |
30,869 |
97.68 |
74.86 |
32.42 |
5.20 |
17.13 |
704,354 |
34.33 |
6.610 |
0.32 |
|
|
2,958 |
46,421 |
30,812 |
6,440 |
93.42 |
77.07 |
... |
13.55 |
13.87 |
39,381 |
... |
... |
... |
|
|
81 |
708 |
497 |
59 |
98.48 |
76.58 |
38.26 |
1.97 |
8.33 |
8,551 |
71.12 |
7 |
0.06 |
|
|
34,159 |
227,361 |
143,124 |
37,368 |
97.55 |
75.33 |
34.80 |
5.47 |
16.44 |
752,286 |
36.43 |
6,617 |
0.32 |
|
vaccinated equals 1,413 which represents secondary operations.
persons of six years and over six years of age.
vaccination.
MARY.
|
AVERAGE NUMBER OF PERSONS |
NUMBER OF CHILDREN SUCCESS- |
Ratio of successful vaccina- |
Total cost of Department. |
Average cost of each success- |
REMARKS. |
||||||
|
Vaccinators |
Persons vacci- |
Under one |
One and under |
||||||||
|
Rs. |
A. |
P. |
Rs. |
A. |
P. |
||||||
|
315 |
2,697.98 |
483,718 |
84,404 |
34.80 |
266,881 |
3 |
8 |
0 |
5 |
11 |
|
|
... |
... |
919 |
116 |
... |
... |
... |
|||||
|
... |
... |
... |
... |
... |
... |
... |
|||||
|
315 |
2,697.88 |
484,637 |
84,520 |
34.86 |
268,681 |
3 |
8 |
0 |
5 |
11 |
|
Set display mode to: Large image | Zoom image | Transcription
Images and transcriptions on this page, including medium image downloads, may be used under the Creative Commons Attribution 4.0 International Licence unless otherwise stated. ![]()
| India Papers > Medicine - Vaccination > Report on vaccination in the Punjab > Vaccination in the Punjab 1919-1929 > Notes on vaccination in the Punjab for the year 1921-22 > (132) Page iii |
|---|
| Permanent URL | https://digital.nls.uk/87222888 |
|---|
| Attribution and copyright: |
|
|---|


