Medicine - Vaccination > 1867-1929 - Report on vaccination in the Punjab > Vaccination in the Punjab 1919-1929 > 1921-1922 - Notes on vaccination in the Punjab for the year 1921-22
(131) Page ii
‹‹‹ prev (130)
Half title page
Download files
Individual page:
Thumbnail gallery: Grid view | List view

ii
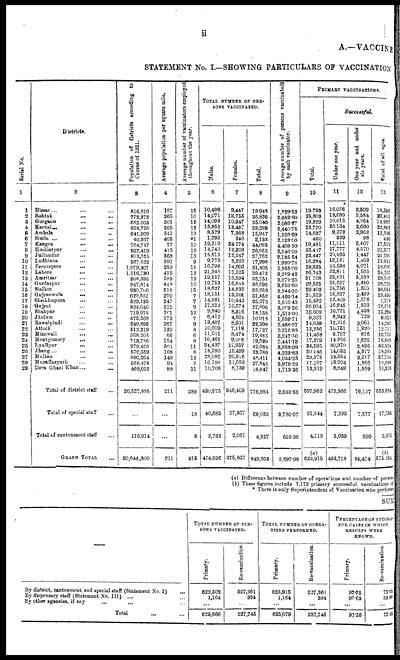
A.—VACCINE
STATEMENT No. I.—SHOWING PARTICULARS OF VACCINATION
|
Serial No. |
Districts. |
Population of districts according to |
Average population per square mile. |
Average number of vaccinators employed |
TOTAL NUMBER OF PER- |
Average number of persons vaccinated |
PRIMARY VACCINATIONS. |
|||||
|
Total. |
Successful. |
|||||||||||
|
Males. |
Females. |
Total. |
Under one year. |
One year and under |
Total of all ages. |
|||||||
|
1 |
2 |
3 |
4 |
5 |
6 |
7 |
8 |
9 |
10 |
11 |
12 |
13 |
|
1 |
Hissar ... ... ... |
816,810 |
157 |
15 |
10,496 |
9,447 |
19,943 |
1,329.53 |
19,783 |
16,056 |
2,509 |
18,596 |
|
2 |
Rohtak ... ... ... |
772,272 |
265 |
10 |
14,071 |
12,755 |
26,826 |
2,682.60 |
25,803 |
18,680 |
3,584 |
22,401 |
|
3 |
Gurgaon ... ... ... |
682,003 |
301 |
12 |
14,093 |
10,947 |
25,040 |
2,086.57 |
19,829 |
10,613 |
4,364 |
14,987 |
|
4 |
Karnal... ... ... ... |
828,726 |
265 |
12 |
15,852 |
13,437 |
29,289 |
2,440.75 |
23,770 |
20,134 |
2,660 |
22,882 |
|
5 |
Ambala ... ... ... |
641,909 |
341 |
13 |
8,579 |
7,368 |
15,947 |
1,226.69 |
14,637 |
9,372 |
2,962 |
12,396 |
|
6 |
Simla ... ... ... |
40,937 |
405 |
*1 |
1,793 |
340 |
2,133 |
2,133.00 |
460 |
339 |
98 |
446 |
|
7 |
Kangra ... ... ... |
764,747 |
77 |
10 |
19,319 |
24,774 |
44,093 |
4,409.30 |
19,481 |
11,811 |
5,407 |
17,529 |
|
8 |
Hoshiarpur ... ... ... |
927,419 |
413 |
12 |
14,743 |
12,209 |
26,952 |
2,246.00 |
23,417 |
17,777 |
4,570 |
22,377 |
|
9 |
Jullundur ... ... ... |
813,525 |
568 |
13 |
15,515 |
12,247 |
27,762 |
2,135.54 |
23,447 |
20,465 |
1,447 |
21,930 |
|
10 |
Ludhiana ... ... ... |
567,622 |
391 |
9 |
9,775 |
8,223 |
17,998 |
1,999.78 |
16,284 |
12,181 |
1,403 |
13,611 |
|
11 |
Ferozepore ... ... ... |
1,079,307 |
252 |
11 |
16,799 |
14,606 |
31,405 |
2,855.00 |
29,835 |
24,538 |
4,021 |
28,690 |
|
12 |
Lahore ... ... ... |
1,116,730 |
415 |
12 |
21,948 |
17,525 |
39,473 |
3,289.42 |
36,143 |
32,811 |
1,595 |
34,537 |
|
13 |
Amritsar ... ... ... |
928,398 |
583 |
12 |
19,157 |
16,594 |
35,751 |
2,979.25 |
31,108 |
23,831 |
5,533 |
29,549 |
|
14 |
Gurdaspur ... ... ... |
847,814 |
449 |
10 |
19,753 |
16,813 |
36,596 |
3,659.60 |
29,525 |
25,237 |
3,380 |
28,720 |
|
15 |
Sialkot ... ... ... |
930,700 |
518 |
15 |
18,827 |
14,836 |
33,663 |
2,244.20 |
29,402 |
24,756 |
1,805 |
26,661 |
|
16 |
Gujranwala ... ... ... |
623,581 |
270 |
7 |
18,151 |
13,301 |
31,452 |
4,493.14 |
21,319 |
16,837 |
2,489 |
19,499 |
|
17 |
Sheikhupura ... ... ... |
523,135 |
247 |
7 |
14,831 |
10,442 |
25,273 |
3,610.43 |
15,492 |
12,403 |
1,578 |
1,573 |
|
18 |
Gujrat ... ... ... |
824,046 |
322 |
9 |
17,322 |
10,574 |
27,896 |
3,099.56 |
20,934 |
16,945 |
1,533 |
18,518 |
|
19 |
Shahpur ... ... ... |
719,918 |
161 |
12 |
9,840 |
8,316 |
18,156 |
1,513.00 |
16,609 |
10,771 |
4,338 |
15,294 |
|
20 |
Jhelum ... ... ... |
475,568 |
172 |
7 |
6,417 |
4,501 |
10,918 |
1,559.71 |
9,337 |
8,242 |
729 |
9,012 |
|
21 |
Rawalpindi ... ... ... |
540,693 |
267 |
9 |
13,497 |
8,901 |
22,398 |
2,488.67 |
14,639 |
12,216 |
2,061 |
14,292 |
|
22 |
Attock ... ... ... |
512,219 |
123 |
8 |
10,609 |
7,118 |
17,727 |
2,215.88 |
13,256 |
10,751 |
1,920 |
12,711 |
|
23 |
Mianwali ... ... ... |
358,205 |
66 |
6 |
11,011 |
8,474 |
19,485 |
3,247.50 |
11,468 |
9,787 |
816 |
10,756 |
|
24 |
Montgomery ... ... ... |
713,786 |
154 |
8 |
10,461 |
9,068 |
19,529 |
2,441.18 |
17,279 |
14,855 |
1,625 |
16,642 |
|
25 |
Lyallpur ... ... ... |
979,463 |
301 |
11 |
24,427 |
17,957 |
42,384 |
8,853.09 |
34,595 |
30,970 |
2,436 |
33,524 |
|
26 |
Jhang ... ... ... |
570,559 |
168 |
8 |
18,290 |
15,499 |
33,789 |
4,223.63 |
20,146 |
14,035 |
4,377 |
18,984 |
|
27 |
Multan ... ... ... |
890,264 |
149 |
12 |
28,095 |
20,316 |
48,411 |
4,034.25 |
29,378 |
24,384 |
3,217 |
27,734 |
|
28 |
Muzaffargarh ... ... ... |
568,478 |
94 |
7 |
16,196 |
11,652 |
27,848 |
3,978.29 |
17,257 |
13,904 |
1,866 |
15,086 |
|
29 |
Dera Ghazi Khan ... ... |
469,052 |
88 |
11 |
10,708 |
8,139 |
18,847 |
1,713.36 |
13,319 |
8,649 |
1,859 |
11,318 |
|
Total of district staff ... |
20,527,886 |
211 |
289 |
430,575 |
346,409 |
776,984 |
2,688.53 |
597,962 |
473,366 |
76,137 |
553,684 |
|
|
Total of special staff ... |
18 |
40,685 |
27,367 |
68,052 |
3,780.67 |
21,834 |
7,293 |
7,577 |
17,634 |
|||
|
Total of cantonment staff |
116,914 |
8 |
2,766 |
2,061 |
4,827 |
603.38 |
4,119 |
3,059 |
690 |
3,976 |
||
|
GRAND TOTAL ... |
20,644,800 |
211 |
315 |
474,026 |
375,837 |
849,863 |
2,697.98 |
(a) |
483,718 |
84,404 |
(b) |
|
(a) Difference between number of operations and number of perso
(b) These figures include 7,172 primary successful vaccinations
* There is only Superintendent of Vaccination who perfom
SUM
|
TOTAL NUMBER OF PER- |
TOTAL NUMBER OF OPERA- |
PERCENTAGE OF SUCCES- |
||||
|
Primary. |
Re-vaccination. |
Primary. |
Re-vaccination. |
Primary. |
Re-vaccination. |
|
|
By district, cantonment, and special staff (Statement No. I) ... |
622,502 |
227,361 |
623,915 |
227,361 |
97.55 |
75.3 |
|
By dispensary staff (Statement No. III) ... ... |
1,164 |
384 |
1,164 |
384 |
97.63 |
83.8 |
|
By other agencies, if any ... ... ... |
... |
... |
... |
... |
... |
... |
|
Total ... |
623,666 |
227,745 |
625,079 |
227,745 |
97.55 |
75.3 |
Set display mode to: Large image | Zoom image | Transcription
Images and transcriptions on this page, including medium image downloads, may be used under the Creative Commons Attribution 4.0 International Licence unless otherwise stated. ![]()
| India Papers > Medicine - Vaccination > Report on vaccination in the Punjab > Vaccination in the Punjab 1919-1929 > Notes on vaccination in the Punjab for the year 1921-22 > (131) Page ii |
|---|
| Permanent URL | https://digital.nls.uk/87222885 |
|---|
| Attribution and copyright: |
|
|---|


