

Medicine - Veterinary > Civil Veterinary Departments > 1895-1951 - Annual report of the Civil Veterinary Department, Bengal > 1898-1899 - Annual report of the Civil Veterinary Department, Bengal, for the year 1898-99 > 1898-99
(40) Page 18
Download files
Individual page:
Thumbnail gallery: Grid view | List view
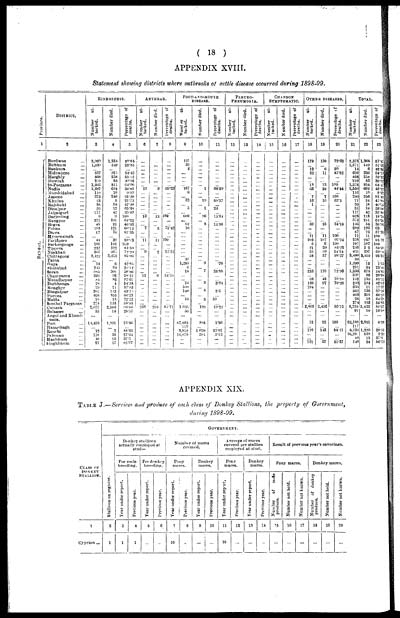
( 18 )
APPENDIX XVIII.
Statement showing districts where outbreaks of cattle disease occurred during 1898-99.
|
Province. |
DISTRICT. |
RINDERPEST. |
ANTHRAX. |
FOOT-AND-MOUTH |
PLEURO- |
CHARBON |
Other diseases. |
Total |
||||||||||||||
|
Number at- |
Number died. |
Percentage of |
Number at- |
Number died. |
Percentage of |
Number at- |
Number died. |
Percentage of |
Number at- |
Number died. |
Percentage of |
Number at- |
Number died. |
Percentage of |
Number at- |
Number died. |
Percentage of |
Number at- |
Number died. |
Percentage of |
||
|
1 |
2 |
3 |
4 |
5 |
6 |
7 |
8 |
9 |
10 |
11 |
|
13 |
14 |
15 |
16 |
17 |
18 |
19 |
20 |
21 |
22 |
23 |
|
BENGAL. |
Burdwan ... |
2,069 |
1,234 |
59 .64 |
... |
... |
... |
125 |
... |
... |
... |
... |
... |
... |
... |
... |
179 |
130 |
72 .62 |
2,373 |
1,364 |
57 47 |
|
Birbbum ... |
1,639 |
549 |
52 8.3 |
... |
... |
... |
32 |
... |
... |
... |
... |
... |
... |
... |
... |
... |
... |
... |
1,071 |
549 |
51 26 |
|
|
Bankura ... |
... |
... |
... |
... |
... |
... |
2 |
... |
... |
... |
... |
... |
... |
... |
... |
l2 |
6 |
50 |
14 |
6 |
42 85 |
|
|
Midnapore ... |
597 |
325 |
54 .43 |
... |
... |
... |
... |
... |
... |
... |
... |
... |
... |
... |
... |
23 |
11 |
47.82 |
620 |
336 |
54 13 |
|
|
Hooghly ... |
468 |
258 |
55. 12 |
... |
... |
... |
... |
... |
... |
... |
... |
... |
... |
... |
... |
... |
... |
... |
468 |
258 |
55 12 |
|
|
Howrah ... |
2:0 |
83 |
39 .32 |
... |
... |
... |
... |
... |
... |
... |
... |
... |
... |
... |
... |
... |
... |
... |
210 |
83 |
39 52 |
|
|
24-Parganas ... |
1,265 |
811 |
64 .90 |
... |
... |
... |
... |
... |
... |
... |
... |
... |
... |
... |
... |
13 |
13 |
100 |
1,278 |
824 |
64 42 |
|
|
Nadia ... |
1,287 |
654 |
50 .81 |
l3 |
9 |
69. 23 |
107 |
1 |
00 .59 |
... |
... |
... |
... |
... |
... |
63 |
28 |
44. 44 |
1,530 |
692 |
43 22 |
|
|
Murshidabad ... |
110 |
10 |
9 .09 |
... |
... |
... |
6 |
... |
... |
... |
... |
... |
... |
... |
... |
... |
... |
... |
116 |
10 |
8 62 |
|
|
Jessore ... |
273 |
240 |
91 .20 |
... |
... |
... |
... |
... |
... |
... |
... |
... |
... |
... |
... |
7 |
7 |
100 |
280 |
256 |
91.48 |
|
|
Khulna ... |
23 |
5 |
21 .73 |
... |
... |
... |
32 |
19 |
59. 37 |
... |
... |
... |
... |
... |
... |
16 |
10 |
62 .5 |
71 |
34 |
47.88 |
|
|
Rajshahi ... |
38 |
18 |
47.38 |
... |
... |
... |
... |
... |
... |
... |
... |
... |
... |
... |
... |
1 |
... |
... |
39 |
18 |
46.15 |
|
|
Dinajpur ... |
26 |
17 |
65. 38 |
... |
... |
5 |
1 |
20 |
... |
... |
... |
... |
... |
... |
... |
... |
... |
31 |
18 |
58.06 |
||
|
Jalpaiguri ... |
117 |
42 |
35 .89 |
... |
... |
... |
... |
... |
... |
... |
... |
... |
... |
... |
... |
... |
... |
... |
117 |
42 |
35.89 |
|
|
Darjeeling ... |
9 |
9 |
100 |
13 |
13 |
100 |
606 |
96 |
15 .84 |
... |
... |
... |
... |
... |
... |
... |
... |
628 |
118 |
18.78 |
||
|
Rangpur ... |
375 |
241 |
64. 26 |
... |
... |
... |
... |
... |
... |
... |
... |
... |
... |
... |
... |
... |
... |
375 |
241 |
64.26 |
||
|
Bogra ... |
45 |
21 |
46 .66 |
... |
... |
... |
62 |
8 |
12. 90 |
.. |
... |
... |
... |
... |
... |
39 |
25 |
64 .10 |
146 |
54 |
36.98 |
|
|
Pabna ... |
183 |
121 |
66 .12 |
7 |
5 |
71. 42 |
10 |
... |
... |
... |
... |
... |
... |
... |
... |
... |
... |
... |
200 |
126 |
03 |
|
|
Dacca ... |
87 |
76 |
87 .35 |
... |
... |
.. |
... |
... |
... |
... |
... |
... |
... |
... |
... |
... |
... |
... |
87 |
70 |
87.35 |
|
|
Mymensingh ... |
... |
... |
... |
... |
... |
... |
... |
... |
... |
... |
... |
... |
... |
... |
... |
11 |
11 |
100 |
11 |
11 |
100 |
|
|
Faridpore ... |
44 |
39 |
88 .63 |
11 |
11 |
100 |
... |
... |
... |
... |
... |
... |
... |
... |
203 |
107 |
97. 04 |
258 |
247 |
95 93 |
||
|
Backergunge ... |
101 |
101 |
110 |
... |
... |
... |
... |
... |
... |
... |
... |
... |
... |
... |
... |
6 |
6 |
100 |
107 |
107 |
100 |
|
|
Tippera ... |
227 |
192 |
84 .58 |
... |
... |
... |
... |
... |
... |
... |
... |
... |
... |
... |
... |
21 |
20 |
85 .23 |
248 |
2 2 |
84 .48 |
|
|
Noakhali ... |
367 |
263 |
72.20 |
9 |
2 |
22 .22 |
... |
... |
... |
... |
... |
... |
... |
... |
... |
55 |
30 |
54. 54 |
431 |
297 |
68. |
|
|
Chittagong ... |
3,422 |
3,253 |
95 .06 |
... |
... |
... |
... |
... |
... |
... |
... |
... |
... |
... |
... |
58 |
57 |
98. 27 |
3,480 |
3,310 |
95.11 |
|
|
Patna... |
... |
... |
... |
... |
... |
... |
30 |
... |
... |
... |
... |
... |
... |
... |
... |
... |
... |
... |
30 |
|||
|
Gaya ... |
14 |
6 |
42. 85 |
... |
... |
... |
1,285 |
9 |
70 |
... |
... |
... |
... |
... |
... |
... |
... |
... |
1,299 |
15 |
1.15 |
|
|
Shahabad ... |
245 |
64 |
26 .12 |
... |
... |
... |
6 |
... |
... |
... |
... |
... |
... |
... |
... |
... |
... |
... |
251 |
64 |
25.49 |
|
|
Saran ... |
985 |
501 |
50 .86 |
... |
... |
... |
18 |
7 |
38 .88 |
... |
... |
... |
... |
... |
... |
233 |
170 |
72. 96 |
1,236 |
678 |
54.85 |
|
|
Champaran ... |
326 |
92 |
28 .22 |
11 |
6 |
54. 5 |
... |
... |
... |
... |
... |
... |
... |
... |
... |
... |
... |
... |
337 |
»8 |
29.08 |
|
|
Muzaffarpur ... |
84 |
82 |
97 .61 |
... |
... |
... |
... |
... |
... |
... |
... |
... |
... |
... |
... |
68 |
48 |
70. 58 |
152 |
130 |
85.52 |
|
|
Darbhanga ... |
28 |
4 |
14 .28 |
... |
... |
... |
76 |
3 |
3. 94 |
... |
... |
... |
... |
... |
... |
138 |
97 |
70 .28 |
242 |
101 |
42.97 |
|
|
Monghyr ... |
29 |
11 |
37 .93 |
... |
... |
... |
500 |
... |
... |
... |
... |
... |
... |
... |
... |
104 |
... |
... |
633 |
11 |
17.37 |
|
|
Bhagalpur... |
302 |
132 |
43 .7 |
... |
... |
... |
160 |
4 |
2 .5 |
... |
... |
... |
... |
... |
... |
... |
... |
... |
302 |
136 |
37.56 |
|
|
Purnea ... |
468 |
310 |
66 .23 |
... |
... |
.. |
... |
... |
... |
... |
... |
... |
... |
... |
... |
... |
... |
... |
468 |
310 |
60-23 |
|
|
Malda ... |
18 |
13 |
72. 22 |
... |
... |
... |
10 |
5 |
50 |
... |
... |
... |
... |
... |
... |
... |
... |
... |
28 |
18 |
64.28 |
|
|
Sonthal Pargnnas |
274 |
153 |
55 .83 |
... |
... |
... |
.. |
... |
... |
... |
... |
... |
... |
... |
... |
... |
... |
... |
274 |
153 |
55.83 |
|
|
Cutttack ... |
2,677 |
2,586 |
69 .60 |
238 |
204 |
85 .71 |
1 033 |
199 |
19. 22 |
... |
... |
... |
... |
... |
... |
2,808 |
2,436 |
86 .75 |
6,758 |
5,425 |
80.27 |
|
|
Balasore ... |
33 |
10 |
28 .57 |
... |
... |
... |
56 |
... |
... |
... |
... |
... |
... |
... |
... |
... |
... |
... |
91 |
10 |
10.98 |
|
|
Angul and Khond- |
... |
... |
. |
... |
... |
... |
... |
... |
... |
... |
... |
... |
... |
... |
... |
... |
... |
... |
... |
... |
... |
|
|
mals. |
14,403 |
1,951 |
13 .46 |
... |
... |
... |
47,683 |
888 |
1. 86 |
... |
... |
... |
... |
... |
... |
12 |
12 |
100 |
62,188 |
2,851 |
4.58 |
|
|
Hazaribagh ... |
... |
... |
... |
... |
... |
... |
117 |
... |
... |
... |
... |
... |
... |
... |
... |
... |
... |
... |
117 |
... |
... |
|
|
Ranchi ... |
12 |
7 |
38 .33 |
... |
... |
.. |
3,952 |
1070 |
27. 07 |
... |
... |
... |
... |
... |
... |
170 |
143 |
84 .11 |
4,134 |
1,220 |
29.51 |
|
|
Palamau ... |
128 |
35 |
27 .34 |
... |
... |
... |
16, 079 |
504 |
3. 13 |
... |
... |
... |
.. |
... |
... |
... |
... |
... |
16,20: |
530 |
3.32 |
|
|
Manbhum ... |
40 |
15 |
37.5 |
... |
... |
... |
... |
... |
... |
... |
... |
... |
... |
... |
... |
... |
... |
... |
40 |
15 |
37.5 |
|
|
Sinhbhum ... |
27 |
17 |
62 .97 |
... |
... |
... |
... |
... |
... |
... |
... |
... |
... |
... |
... |
121 |
67 |
55 .37 |
148 |
84 |
58.75 |
|
APPENDIX XIX.
TABLE J.— Services and produce of each class of Donkey Stallions, the property of Government,
during1898-99.
|
CLASS OF |
GOVERNMENT. |
||||||||||||||||||
|
Stallions on register. |
Donkey stallions |
Number of mares |
Average of mares |
Result of previous year's coverings. |
|||||||||||||||
|
For mule |
For donkey |
Pony |
Donkey |
Pony |
Donkey |
Pony mares. |
Donkey mares. |
||||||||||||
|
Year under report. |
Previous year. |
Year under report. |
Previous year. |
Year under report. |
Previous year. |
Year under report. |
Previous year. |
Year under report. |
Previous year. |
Year under report. |
Previous year. |
Number of mute |
Number not held. |
Number not known. |
Number of donkey |
Number not held. |
Number not known. |
||
|
1 |
2 |
3 |
4 |
5 |
6 |
7 |
8 |
9 |
10 |
11 |
12 |
13 |
14 |
15 |
16 |
17 |
18 |
19 |
20 |
|
Cyprian ... |
1 |
1 |
1 |
... |
... |
10 |
... |
... |
... |
10 |
... |
... |
... |
... |
... |
... |
... |
... |
... |
Set display mode to: Large image | Zoom image | Transcription
Images and transcriptions on this page, including medium image downloads, may be used under the Creative Commons Attribution 4.0 International Licence unless otherwise stated. ![]()
| Permanent URL | https://digital.nls.uk/76342251 |
|---|
| Description | Covers 1895-1951 and documents the work of the Bengal CVD. Records horse, mule and cattle breeding, stock lists, animal fairs, bacteriological work, disease outbreaks, veterinary education and staff activities. Supplemented by tables. |
|---|---|
| Shelfmark | IP/6/VB.3 |
| Additional NLS resources: | |
| Attribution and copyright: |
|
| Description | Reports dated 1887-1950 record activities of the Civil Veterinary Department across India. Plus minutes, memoirs and ledgers concerning veterinary officers and their work. |
|---|---|
| Shelfmark | India Papers |
| Description | The Veterinary collection consists of 146 volumes dating from 1864 to 1959. Divided into veterinary diseases, colleges and laboratories and Civil Veterinary Departments. Extensive research on trypanosomiasis and rinderpest. Reports show how veterinary medicine controlled disease, maintained livestock and alleviated famine. They explore its effect on military and local communities. |
|---|---|
| Shelfmark | India Papers |
| Description | The India Papers collection contains publications of the central (Imperial) Government and many Indian states. Most states came under British rule. Much of the collection dates from between the post-Mutiny re-organisation of the Indian Government and Indian Independence in 1947. Some items published in London by John Murray. |
|---|---|
| Shelfmark | India Papers |
| Additional NLS resources: | |