Medicine - Institutions > Army health reports and medical documents > Vital statistics of India. Vol. IV, Annual returns from 1871 to 1876. British Army of India, Native Army and jails of Bengal > Jail population, 1876
(779)
Download files
Individual page:
Thumbnail gallery: Grid view | List view

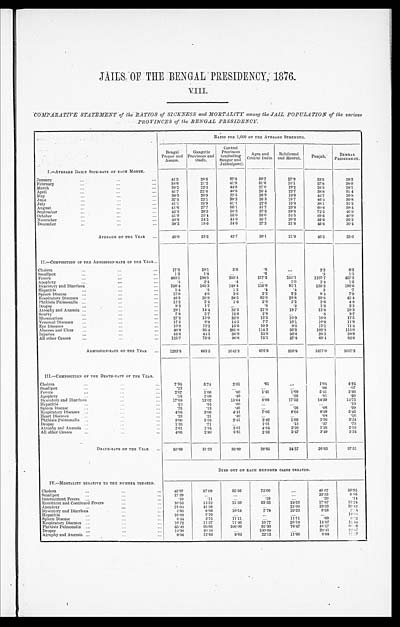
JAILS OF THE BENGAL PRESIDENCY, 1876.
VIII.
COMPARATIVE STATEMENT of the RATIOS of SICKNESS and MORTALITY among the JAIL POPULATION of the various
PROVINCES of the BENGAL PRESIDENCY.
| RATIO PER 1,000 OF THE AVERAGE STRENGTH. | |||||||
| Bengal Proper and Assam. |
Gangetic Provinces and Oudh. |
Central Provinces (excluding Saugor and Jubbulpore). |
Agra and Central India. |
Rohilcund and Meerut. |
Punjab. | BENGAL PRESIDENCY. |
|
| I.—AVERAGE DAILY SICK-RATE OF EACH MONTH. | |||||||
| January | 41.5 | 20.6 | 37.8 | 30.7 | 17.9 | 33.5 | 29.3 |
| February | 38.6 | 21.2 | 41.9 | 31.6 | 18.1 | 27.8 | 28.0 |
| March | 39.2 | 22.3 | 44.0 | 27.0 | 19.2 | 26.3 | 28.1 |
| April | 41.7 | 22.6 | 40.8 | 26.4 | 22.7 | 38.8 | 31.4 |
| May | 36.3 | 20.9 | 37.5 | 26.9 | 18.6 | 42.7 | 29.8 |
| June | 37.5 | 22.1 | 38.2 | 26.3 | 15.7 | 46.4 | 30.8 |
| July | 41.1 | 25.9 | 41.1 | 22.6 | 15.8 | 38.1 | 31.2 |
| August | 41.6 | 27.7 | 56.1 | 31.7 | 23.8 | 60.6 | 38.4 |
| September | 42.3 | 26.3 | 50.3 | 37.8 | 26.8 | 72.5 | 40.9 |
| October | 41.9 | 25.4 | 55.6 | 38.0 | 34.5 | 69.6 | 40.9 |
| November | 40.6 | 24.2 | 44.6 | 35.7 | 26.6 | 56.6 | 36.2 |
| December | 38.2 | 19.6 | 34.6 | 27.2 | 21.8 | 45.6 | 30.4 |
| AVERAGE OF THE YEAR | 40.0 | 23.2 | 43.7 | 30.1 | 21.9 | 46.5 | 33.0 |
| II.—COMPOSITION OF THE ADMISSION-RATE OF THE YEAR | |||||||
| Cholera | 17.3 | 10.1 | 3.6 | .8 | 2.2 | 8.3 | |
| Smallpox | 1.3 | 1.8 | .6 | .2 | 1.1 | ||
| Fevers | 483.1 | 198.5 | 350.4 | 217.3 | 255.1 | 1107.7 | 457.5 |
| Apoplexy | .2 | 2.4 | .4 | 1.0 | 2.4 | 1.5 | |
| Dysentery and Diarrhœa | 356.4 | 145.3 | 148.4 | 116.6 | 91.1 | 150.2 | 190.6 |
| Hepatitis | 1.4 | .5 | 1.2 | .4 | .4 | 2 | .7 |
| Spleen Disease | 17.0 | 4.6 | 3.6 | 2.2 | 2.3 | 8.4 | 7.9 |
| Respiratory Diseases | 46.5 | 26.9 | 38.5 | 65.6 | 28.6 | 59.6 | 41.4 |
| Phthisis Pulmonalis | 12.2 | 2.4 | 1.6 | 2.6 | 2.2 | 2.6 | 4.8 |
| Dropsy | 9.3 | 1.7 | .8 | .3 | 1.3 | 3.2 | |
| Atrophy and Anæmia | 29.1 | 14.4 | 32.5 | 21.0 | 18.7 | 12.8 | 19.3 |
| Scurvy | 7.8 | 2.7 | 15.6 | 2.8 | .5 | 3.7 | |
| Rheumatism | 27.2 | 13.9 | 22.9 | 12.5 | 10.9 | 16.0 | 17.5 |
| Venereal Diseases | 17.5 | 9.8 | 14.5 | 7.7 | 10.1 | 10.8 | 11.9 |
| Eye Diseases | 10.3 | 12.2 | 15.6 | 10.9 | 9.5 | 12.1 | 11.4 |
| Abscess and Ulcer | 86.9 | 95.4 | 261.0 | 114.2 | 56.2 | 192.3 | 115.0 |
| Injuries | 44.6 | 44.1 | 36.9 | 25.8 | 36.6 | 28.3 | 38.8 |
| All other Causes | 125.7 | 76.8 | 96.6 | 75.1 | 27.8 | 69.4 | 82.6 |
| ADMISSION-RATE OF THE YEAR | 1293.8 | 663.5 | 1043.3 | 676.9 | 550.8 | 1677.0 | 1017.2 |
| III.—COMPOSITION OF THE DEATH-RATE OF THE YEAR. | |||||||
| Cholera | 7.94 | 5.74 | 2.01 | .61 | 1.04 | 4.24 | |
| Smallpox | .23 | .08 | .07 | ||||
| Fevers | 2.67 | 1.00 | .80 | 1.41 | 1.69 | 5.41 | 2.36 |
| Apoplexy | .18 | 1.00 | .40 | .26 | .81 | .59 | |
| Dysentery and Diarrhœa | 17.68 | 13.02 | 15.64 | 9.08 | 17.52 | 14.39 | 14.75 |
| Hepatitis | .23 | .04 | .80 | .10 | |||
| Spleen Disease | .75 | .13 | .40 | .26 | .08 | .29 | |
| Respiratory Diseases | 4.98 | 3.06 | 4.41 | 7.06 | 8.05 | 8.38 | 5.45 |
| Heart Diseases | .23 | .21 | .40 | .08 | .16 | ||
| Phthisis Pulmonalis | 8.00 | 1.68 | 2.41 | 2.42 | 1.69 | 1.26 | 3.24 |
| Dropsy | 1.33 | .71 | 1.01 | .13 | .37 | .73 | |
| Atrophy and Anæmia | 2.61 | 1.84 | 2.81 | 4.64 | 2.20 |
1.26 | 2.19 |
| All other Causes | 4.06 | 2.80 | 6.81 | 2.62 | 2.47 | 3.49 | 3.34 |
| DEATH-RATE OF THE YEAR | 50.89 | 31.23 | 36.89 | 28.85 | 34.27 | 36.65 | 37.51 |
| DIED OUT OF EACH HUNDRED CASES TREATED. | |||||||
| IV.—MORTALITY RELATIVE TO THE NUMBER TREATED. | |||||||
| Cholera | 45.97 | 57.08 | 55.56 | 75.00 | 46.67 | 50.95 | |
| Smallpox | 17.39 | 33.33 | 6.85 | ||||
| Intermittent Fevers | .10 | .11 | .19 | .20 | .14 | ||
| Remittent and Continued Fevers | 10.56 | 15.52 | 12.50 | 83.33 | 24.53 | 17.87 | 15.24 |
| Apoplexy | 75.00 | 41.38 | 25.00 | 33.33 | 39.42 | ||
| Dysentery and Diarrhœa | 4.96 | 8.96 | 10.54 | 7.79 | 19.23 | 9.58 | 7.74 |
| Hepatitis | 16.00 | 7.70 | 14.58 | ||||
| Spleen Disease | 4.44 | 2.75 | 11.11 | 11.11 | .89 | 3.62 | |
| Respiratory Diseases | 10.72 | 11.37 | 11.46 | 10.77 | 28.18 | 14.07 | 13.16 |
| Phthisis Pulmonalis | 65.40 | 68.96 | 100.00 | 92.30 | 76.47 | 48.57 | 66.86 |
| Dropsy | 14.38 | 40.48 | 100.00 | 29.41 | 22.67 | ||
| Atrophy and Anæmia | 8.96 | 12.83 | 8.64 | 22.12 | 11.80 | 9.88 | 11.37 |
Set display mode to: Large image | Zoom image | Transcription
Images and transcriptions on this page, including medium image downloads, may be used under the Creative Commons Attribution 4.0 International Licence unless otherwise stated. ![]()
| Permanent URL | https://digital.nls.uk/75012379 |
|---|


