

Medicine - Institutions > Army health reports and medical documents > Vital statistics of India. Vol. IV, Annual returns from 1871 to 1876. British Army of India, Native Army and jails of Bengal > Jail population, 1876
(778)
Download files
Individual page:
Thumbnail gallery: Grid view | List view
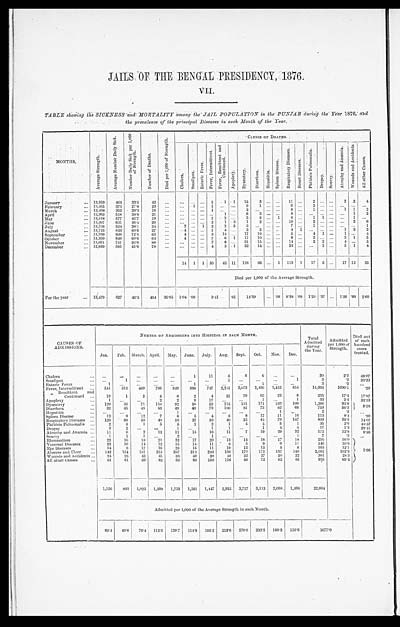
JAILS OF THE BENGAL PRESIDENCY, 1876.
VII.
TABLE showing the SICKNESS and MORTALITY among the JAIL, POPULATION in the PUNJAB during the Year 1876, and
the prevalence of the principal Diseases in each Month of the Year.
| MONTHS | Average Strength. | Average Number Daily Sick. | Number Daily Sick per 1,000 of Strength. |
Number of Deaths. | Died per 1,000 of Strength. | CAUSES OF DEATHS. | |||||||||||||||||
| Cholera. | Smallpox. | Enteric Fever. | Fever, Intermittent. | Fever, Remittent and Continued. |
Apoplexy. | Dysentery. | Diarrhœa. | Hepatitis. | Spleen disease. | Respiratory Diseases. | Heart Diseases. | Phthisis Pulmonalis. | Dropsy. | Scurvy. | Atrophy and Anæmia. | Wounds and Accidents. | All other Causes. | ||||||
| January | 13,859 | 464 | 33.5 | 42 | 1 | 1 | 1 | 15 | 3 | 11 | 2 | 2 | 2 | 4 | |||||||||
| February | 13,465 | 375 | 27.8 | 23 | 1 | 1 | 9 | 1 | 9 | 2 | |||||||||||||
| March | 13,408 | 352 | 26.3 | 16 | 1 | 2 | 8 | 1 | 1 | 1 | 2 | ||||||||||||
| April | 13,363 | 518 | 38.8 | 21 | 1 | 6 | 3 | 8 | 1 | 2 | |||||||||||||
| May | 13,518 | 577 | 42.7 | 19 | 1 | 2 | 3 | 3 | 1 | 6 | 1 | 1 | 1 | ||||||||||
| June | 13,597 | 631 | 46.4 | 29 | 2 | 1 | 3 | 1 | 2 | 10 | 2 | 2 | 6 | ||||||||||
| July | 13,756 | 524 | 38.1 | 24 | 2 | 1 | 2 | 2 | 5 | 3 | 7 | 1 | 1 | ||||||||||
| August | 13,743 | 833 | 60.6 | 27 | 4 | 1 | 4 | 2 | 5 | 4 | 1 | 1 | 3 | 2 | |||||||||
| September | 13,769 | 998 | 72.5 | 63 | 4 | 3 | 14 | 17 | 10 | 5 | 4 | 1 | 1 | 4 | |||||||||
| October | 13,350 | 929 | 69.6 | 64 | 4 | 7 | 6 | 1 | 17 | 10 | 8 | 2 | 3 | 1 | 5 | ||||||||
| November | 13,091 | 741 | 56.6 | 88 | 7 | 8 | 31 | 15 | 14 | 2 | 2 | 4 | 5 | ||||||||||
| December | 12,830 | 585 | 45.6 | 78 | 4 | 3 | 1 | 22 | 14 | 23 | 1 | 5 | 1 | 4 | |||||||||
| 14 | 1 | 1 | 30 | 42 | 11 | 128 | 66 | 1 | 113 | 1 | 17 | 5 | 17 | 12 | 35 | ||||||||
| Died per 1,000 of the Average Strength. | |||||||||||||||||||||||
| For the year | 13,479 | 627 | 46.5 | 494 | 36.65 | 1.04 | .08 | 5.41 | .81 | 14.39 | .08 | 8.38 | .08 | 1.26 | .37 | 1.26 | .89 | 2.60 | |||||
| CAUSES OF ADMISSIONS. |
NUMBER OF ADMISSIONS INTO HOSPITAL IN EACH MONTH. | Total Admitted during the Year. |
Admitted per 1,000 of Strength. |
Died out of each hundred cases treated. |
|||||||||||
| Jan. | Feb. | March. | April. | May. | June. | July. | Aug. | Sept. | Oct. | Nov. | Dec. | ||||
| Cholera | 1 | 11 | 6 | 6 | 6 | 30 | 2.2 | 46.67 | |||||||
| Smallpox | 1 | 1 | 1 | 3 | .2 | 33.33 | |||||||||
| Enteric Fever | 1 | 1 | 1 | 3 | .2 | ||||||||||
| Fever, Intermittent | 541 | 313 | 469 | 766 | 949 | 898 | 747 | 2,231 | 3,073 | 2,400 | 1,452 | 854 | 14,693 | 1090.1 | .20 |
| " Remittent and Continued |
19 | 1 | 2 | 4 | 6 | 2 | 4 | 31 | 70 | 65 | 23 | 8 | 235 | 17.4 | 17.87 |
| Apoplexy | 1 | 2 | 2 | 9 | 17 | 1 | 1 | 33 | 2.4 | 33.33 | |||||
| Dysentery | 120 | 56 | 71 | 110 | 92 | 56 | 52 | 115 | 151 | 171 | 163 | 109 | 1,266 | 93.9 | 9.58 |
| Diarrhœa | 32 | 45 | 48 | 53 | 49 | 49 | 79 | 100 | 81 | 73 | 82 | 68 | 759 | 56.3 | |
| Hepatitis | 1 | 1 | 2 | .2 | |||||||||||
| Spleen Disease | 12 | 9 | 12 | 7 | 6 | 5 | 4 | 6 | 8 | 17 | 11 | 16 | 113 | 8.4 | .89 |
| Respiratory Diseases | 128 | 88 | 58 | 49 | 58 | 37 | 50 | 40 | 25 | 44 | 79 | 147 | 803 | 59.6 | 14.07 |
| Phthisis Pulmonalis | 2 | 3 | 1 | 5 | 5 | 2 | 2 | 1 | 4 | 4 | 5 | 1 | 35 | 2.6 | 48.57 |
| Dropsy | 3 | 2 | 1 | 1 | 1 | 1 | 4 | 4 | 17 | 1.3 | 29.41 | ||||
| Atrophy and Anæmia | 11 | 6 | 2 | 13 | 11 | 15 | 16 | 11 | 7 | 19 | 29 | 32 | 172 | 12.8 | 9.88 |
| Scurvy | 1 | 1 | 1 | 2 | 1 | 1 | 7 | .5 | |||||||
| Rheumatism | 22 | 16 | 18 | 21 | 22 | 17 | 20 | 13 | 14 | 18 | 17 | 18 | 216 | 16.0 | 1.08 |
| Venereal Diseases | 22 | 16 | 14 | 12 | 15 | 14 | 11 | 8 | 5 | 9 | 9 | 11 | 146 | 10.8 | |
| Eye Diseases | 14 | 8 | 17 | 16 | 26 | 15 | 11 | 19 | 12 | 13 | 4 | 8 | 163 | 12.1 | |
| Abscess and Ulcer | 142 | 154 | 181 | 315 | 387 | 312 | 283 | 196 | 173 | 172 | 137 | 140 | 2,592 | 192.3 | |
| Wounds and Accidents | 24 | 23 | 42 | 45 | 38 | 40 | 38 | 40 | 22 | 27 | 20 | 22 | 381 | 28.3 | |
| All other Causes | 61 | 61 | 89 | 82 | 83 | 88 | 100 | 116 | 66 | 72 | 62 | 55 | 935 | 69.4 | |
| 1,156 | 803 | 1,025 | 1,500 | 1,753 | 1,561 | 1,447 | 2,935 | 3,717 | 3,113 | 2,098. | 1,496 | 22,604 | |||
| Admitted per 1,000 of the Average Strength in each Month. | |||||||||||||||
| 83.4 | 59.6 | 76.4 | 112.3 | 129.7 | 114.8 | 105.2 | 213.6 | 270.0 | 233.2 | 160.3 | 116.6 | 1677.0 | |||
Set display mode to: Large image | Zoom image | Transcription
Images and transcriptions on this page, including medium image downloads, may be used under the Creative Commons Attribution 4.0 International Licence unless otherwise stated. ![]()
| Permanent URL | https://digital.nls.uk/75012376 |
|---|
| Description | Part of series is called Annual returns of the European Army of India and of the native army and jail populations of the Bengal Presidency for the years from 1871-1876. Contains extensive tables about native and European army, women and children and prisoners. |
|---|---|
| Shelfmark | IP/QA.5 |
| Additional NLS resources: | |
| Description | 12 titles describe the health and sanitary conditions of the army in India. Lists British, European and Indian troops plus families of military personnel. 3 volumes of army regulations included. 73 volumes make up the Scientific Memoirs series, a journal by Indian Medical Service staff. |
|---|---|
| Description | The Institutions collection consists of 106 volumes from British India, dating from the 1860's to the 1940's. Divided into reports on medical institutions, army health, and lock hospitals. Education of indigenous medical students and maintenance of troop health shown in annual reports and statistical tables. |
|---|---|
| Description | The India Papers collection contains publications of the central (Imperial) Government and many Indian states. Most states came under British rule. Much of the collection dates from between the post-Mutiny re-organisation of the Indian Government and Indian Independence in 1947. Some items published in London by John Murray. |
|---|---|
| Shelfmark | India Papers |