

Medicine - Institutions > Reports from medical colleges, schools and research institutions > Report of the King Institute of Preventive Medicine, Guindy > Report of the King Institute of Preventive Medicine Guindy for the year ending 31st March 1927
(309) Page 24
Download files
Individual page:
Thumbnail gallery: Grid view | List view
24
REPORT OF THE KING INSTITUTE, GUINDY
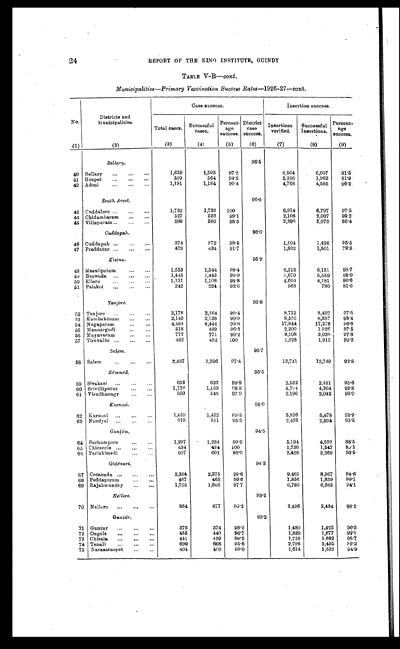
TABLE V-B—cont.
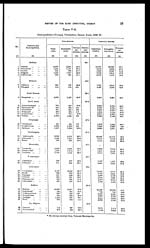
Municipalities—Primary Vaccination Success Rates—1926-27—cont.
| No. | Districts and Municipalities. |
Case success. | Insertion success. | |||||
| Total cases. | Successful cases. |
Percent- age success. |
District case success. |
Insertions verified. |
Successful Insertions. |
Percent- age success. |
||
| (1) | (2) | (3) | (4) | (5) | (6) | (7) | (8) | (9) |
| Bellary. | 96.5 | |||||||
| 40 | Bellary . . . | 1,639 | 1,593 | 97.2 | 6,564 | 6,007 | 91.5 | |
| 41 | Hospet . . . | 599 | 564 | 94.2 | 2,396 | 1,962 | 81.9 | |
| 42 | Adoni . . . | 1,191 | 1,184 | 99.4 | 4,768 | 4,585 | 96.2 | |
| South Arcot. | 96.5 | |||||||
| 43 | Cuddalore . . . | 1,732 | 1,732 | 100 | 6,974 | 6,797 | 97.5 | |
| 44 | Chidambaram . . . | 527 | 522 | 99.1 | 2,108 | 2,007 | 95.2 | |
| 45 | Villupuram . . . | 599 | 580 | 98.3 | 2,396 | 2,072 | 86.4 | |
| Cuddapah. | 96.0 | |||||||
| 46 | Cuddapah . . . | 374 | 372 | 99.5 | 1,504 | 1,436 | 95.5 | |
| 47 | Proddatur . . . | 473 | 434 | 91.7 | 1,892 | 1,501 | 79.3 | |
| Kisna. | 95.9 | |||||||
| 48 | Masulipatam . . . | 1,553 | 1,544 | 99.4 | 6,212 | 6,131 | 98.7 | |
| 49 | Bezwada . . . | 1,445 | 1,443 | 99.9 | 5,670 | 5,559 | 98.0 | |
| 50 | Ellore . . . | 1,121 | 1,108 | 98.8 | 4,604 | 4,181 | 90.8 | |
| 51 | Palakol . . . | 242 | 224 | 92.6 | 968 | 790 | 81.6 | |
| Tanjore. | 95.8 | |||||||
| 52 | Tanjore . . . | 2,173 | 2,164 | 99.4 | 8,712 | 8,492 | 97.5 | |
| 53 | Kumbakōnam . . . | 2,140 | 2,138 | 99.9 | 8,526 | 8,387 | 98.4 | |
| 54 | Negapatam . . . | 4,464 | 4,444 | 99.6 | 17,844 | 17,278 | 96.8 | |
| 55 | Mannargudi . . . | 518 | 499 | 96.3 | 2,200 | 1,926 | 87.5 | |
| 56 | Mayavaram . . . | 777 | 77l | 99.2 | 3,108 | 3,039 | 97.8 | |
| 57 | Tiruvalūr . . . | 482 | 482 | 100 | 1,928 | 1,912 | 99.2 | |
| Salem. | 95.7 | |||||||
| 58 | Salem . . . | 3,487 | 3,396 | 97.4 | 13,741 | 12,749 | 92.8 | |
| Rāmnād. | 95.5 | |||||||
| 59 | Sivakasi . . . | 633 | 632 | 99.8 | 2,532 | 2,421 | 95.6 | |
| 60 | Srivilliputur . . . | 1,176 | 1,163 | 98.9 | 4,784 | 4,364 | 92.8 | |
| 61 | Virudhanagr . . . | 560 | 548 | 97.9 | 2,196 | 2,042 | 93.0 | |
| Kurnool. | 95.0 | |||||||
| 62 | Kurnool . . . | 1,459 | 1,452 | 99.5 | 5,836 | 5,478 | 93.9 | |
| 63 | Nandyal . . . | 619 | 591 | 95.5 | 2,476 | 2,364 | 95.5 | |
| Ganjām. | 94.5 | |||||||
| 64 | Berhampore . . . | 1,297 | 1,284 | 99.0 | 5,194 | 4,599 | 88.5 | |
| 65 | Chicacole . . . | 434 | 434 | 100 | 1,736 | 1,547 | 83.1 | |
| 66 | Parlakimedi . . . | 607 | 601 | 99.0 | 2,428 | 2,289 | 93.5 | |
| Gōdāvari. | 94.3 | |||||||
| 67 | Cocanada . . . | 2,384 | 2,375 | 99.6 | 9,465 | 8,967 | 94.6 | |
| 68 | Peddapuram . . . | 467 | 465 | 99.6 | 1,856 | 1,839 | 99.1 | |
| 69 | Rajahmundry . . . | 1,705 | 1,666 | 97.7 | 6,780 | 6,383 | 94.1 | |
| Nellore. | 93.2 | |||||||
| 70 | Nellore . . . | 884 | 877 | 99.2 | 3,496 | 3,434 | 98.2 | |
| Guntūr. | 93.2 | |||||||
| 71 | Guntur . . . | 378 | 374 | 98.9 | 1.480 | 1,425 | 96.3 | |
| 72 | Ongole . . . | 455 | 440 | 96.7 | 1,820 | 1,677 | 92.1 | |
| 73 | Chirala . . . | 441 | 439 | 99.5 | 1,758 | 1,682 | 95.7 | |
| 74 | Tenali . . . | 699 | 668 | 95.6 | 2,796 | 2,495 | 89.2 | |
| 75 | Narasaraopet . . . | 404 | 400 | 99.0 | 1,614 | 1,532 | 94.9 | |
Set display mode to: Large image | Zoom image | Transcription
Images and transcriptions on this page, including medium image downloads, may be used under the Creative Commons Attribution 4.0 International Licence unless otherwise stated. ![]()
| Permanent URL | https://digital.nls.uk/74937231 |
|---|
| Description | Describes lymph issue, cholera, typhoid fever outbreaks. Investigations into dysentery, relapsing fever, gastro-enteritis, glandular fever, malaria and chicken pox. Lists examination of water supplies. Production shown for prophylactic cholera and combined typhoid/paratyphoid (T.A.B.) vaccines. Includes anti-meningococcal and anti-influenza vaccines. Food standards examinations supplement reports. |
|---|---|
| Shelfmark | IP/25/KZ.5 |
| Additional NLS resources: | |
| Description | 13 titles. Describes research work and conditions, treatments, vaccine production, medical education, public health and disease outbreaks. Extensive tables show mortality rates and patient admissions. These - some from asylums, jails, dispensaries, civil and police hospitals – will be useful to epidemiologists. |
|---|
| Description | The Institutions collection consists of 106 volumes from British India, dating from the 1860's to the 1940's. Divided into reports on medical institutions, army health, and lock hospitals. Education of indigenous medical students and maintenance of troop health shown in annual reports and statistical tables. |
|---|---|
| Description | The India Papers collection contains publications of the central (Imperial) Government and many Indian states. Most states came under British rule. Much of the collection dates from between the post-Mutiny re-organisation of the Indian Government and Indian Independence in 1947. Some items published in London by John Murray. |
|---|---|
| Shelfmark | India Papers |