

Medicine - Disease > Report of an investigation in regard to the prevalence of stegomyia and other mosquitoes in Karachi, and the measures necessary for their control
(18) Page 4
Download files
Individual page:
Thumbnail gallery: Grid view | List view
4
January being the coldest with an average mean temperature of 65.9 F., and June the warmest with an average of 87.6 F. The months from April to October show a mean maximum temperature of 89 F. and the months from November to March a mean maximum of 75 F. (Table 1-page 30).
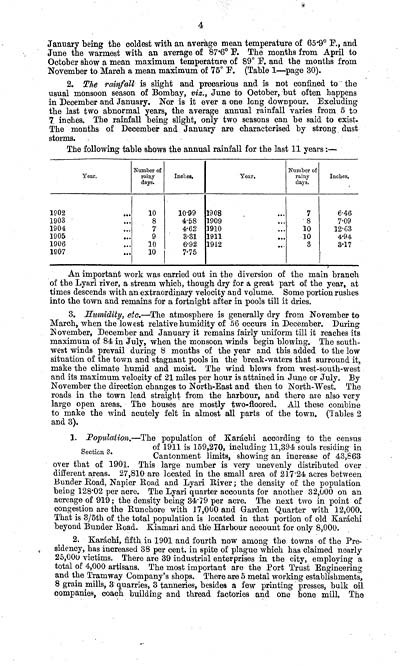
2. The rainfall is slight and precarious and is not confined to the usual monsoon season of Bombay, viz., June to October, but often happens in December and January. Nor is it ever a one long downpour. Excluding the last two abnormal years, the average annual rainfall varies from 5 to 7 inches. The rainfall being slight, only two seasons can be said to exist. The months of December and January are characterised by strong dust storms.
The following table shows the annual rainfall for the last 11 years:-
Year.
Number of rainy days.
Inches.
Year.
Number of rainy days.
Inches.
1902
...
10
1099
1908
...
7
646
1903
...
8
458
1909
...
8
709
1904
...
7
462
1910
...
10
1203
1905
...
9
331
1911
...
10
494
1906
...
10
692
1912
...
3
317
1907
...
10
7-75
An important work was carried out in the diversion of the main branch of the Lyari river, a stream which, though dry for a great part of the year, at times descends with an extraordinary velocity and volume. Some portion rushes into the town and remains for a fortnight after in pools till it dries.
3. Humidity, etc.-The atmosphere is generally dry from November to March, when the lowest relative humidity of 56 occurs in December. During November, December and January it remains fairly uniform till it reaches its maximum of 84 in July, when the monsoon winds begin blowing. The southwest winds prevail during 8 months of the year and this added to the low situation of the town and stagnant pools in the break-waters that surround it, make the climate humid and moist. The wind blows from west-south-west and its maximum velocity of 21 miles per hour is attained in June or July. By November the direction changes to North-East and then to North-West. The roads in the town lead straight from the harbour, and there are also very large open areas. The houses are mostly two-floored. All these combine to make the wind acutely felt in almost all parts of the town. (Tables 2 and 3).
Section 3.
1. Population.-The population of Karachi according to the census
of 1911 is 159,270, including 11,394 souls residing in Cantonment limits, showing an increase of 43,863
over that of 1901. This large number is very unevenly distributed over different areas. 27,810 are located in the small area of 21724 acres between Bunder Road, Napier Road and Lyari River; the density of the population being 12802 per acre. The Lyari quarter accounts for another 32,000 on an acreage of 919; the density being 34.79 per acre. The next two in point of congestion are the Runchore with 17,000 and Garden Quarter with 12,000. That is 3/5th of the total population is located in that portion of old Karachi beyond Bunder Road. Kiamari and the Harbour account for only 8,000.
2. Karachi, fifth in 1901 and fourth now among the towns of the Presidency, has increased 38 per cent. in spite of plague which has claimed nearly 25,000 victims. There are 39 industrial enterprises in the city, employing a total of 4,000 artisans. The most important are the Port Trust Engineering and the Tramway Company's shops. There are 5 metal working establishments, 8 grain mills, 3 quarries, 3 tanneries, besides a few printing presses, bulk oil companies, coach building and thread factories and one bone mill. The
January being the coldest with an average mean temperature of 65.9 F., and June the warmest with an average of 87.6 F. The months from April to October show a mean maximum temperature of 89 F. and the months from November to March a mean maximum of 75 F. (Table 1-page 30).
2. The rainfall is slight and precarious and is not confined to the usual monsoon season of Bombay, viz., June to October, but often happens in December and January. Nor is it ever a one long downpour. Excluding the last two abnormal years, the average annual rainfall varies from 5 to 7 inches. The rainfall being slight, only two seasons can be said to exist. The months of December and January are characterised by strong dust storms.
The following table shows the annual rainfall for the last 11 years:-
Year.
Number of rainy days.
Inches.
Year.
Number of rainy days.
Inches.
1902
...
10
1099
1908
...
7
646
1903
...
8
458
1909
...
8
709
1904
...
7
462
1910
...
10
1203
1905
...
9
331
1911
...
10
494
1906
...
10
692
1912
...
3
317
1907
...
10
7-75
An important work was carried out in the diversion of the main branch of the Lyari river, a stream which, though dry for a great part of the year, at times descends with an extraordinary velocity and volume. Some portion rushes into the town and remains for a fortnight after in pools till it dries.
3. Humidity, etc.-The atmosphere is generally dry from November to March, when the lowest relative humidity of 56 occurs in December. During November, December and January it remains fairly uniform till it reaches its maximum of 84 in July, when the monsoon winds begin blowing. The southwest winds prevail during 8 months of the year and this added to the low situation of the town and stagnant pools in the break-waters that surround it, make the climate humid and moist. The wind blows from west-south-west and its maximum velocity of 21 miles per hour is attained in June or July. By November the direction changes to North-East and then to North-West. The roads in the town lead straight from the harbour, and there are also very large open areas. The houses are mostly two-floored. All these combine to make the wind acutely felt in almost all parts of the town. (Tables 2 and 3).
Section 3.
1. Population.-The population of Karachi according to the census
of 1911 is 159,270, including 11,394 souls residing in Cantonment limits, showing an increase of 43,863
over that of 1901. This large number is very unevenly distributed over different areas. 27,810 are located in the small area of 21724 acres between Bunder Road, Napier Road and Lyari River; the density of the population being 12802 per acre. The Lyari quarter accounts for another 32,000 on an acreage of 919; the density being 34.79 per acre. The next two in point of congestion are the Runchore with 17,000 and Garden Quarter with 12,000. That is 3/5th of the total population is located in that portion of old Karachi beyond Bunder Road. Kiamari and the Harbour account for only 8,000.
2. Karachi, fifth in 1901 and fourth now among the towns of the Presidency, has increased 38 per cent. in spite of plague which has claimed nearly 25,000 victims. There are 39 industrial enterprises in the city, employing a total of 4,000 artisans. The most important are the Port Trust Engineering and the Tramway Company's shops. There are 5 metal working establishments, 8 grain mills, 3 quarries, 3 tanneries, besides a few printing presses, bulk oil companies, coach building and thread factories and one bone mill. The
Set display mode to: Large image | Zoom image | Transcription
Images and transcriptions on this page, including medium image downloads, may be used under the Creative Commons Attribution 4.0 International Licence unless otherwise stated. ![]()
| Permanent URL | https://digital.nls.uk/74572926 |
|---|
| Description | Includes yellow fever introduction, descriptions of Karachi and mosquitoes of Karachi. Also preventive measures. Includes maps. |
|---|---|
| Shelfmark | IP/13/SB.2 |
| Additional NLS resources: | |
| Description | The Disease collection consists of 51 volumes from British India, dating from 1868 to 1920. Official publications varying from short reports to multi-volume histories related to disease, public health and medical research. Focuses on cholera, leprosy, plague and malaria. |
|---|---|
| Description | The India Papers collection contains publications of the central (Imperial) Government and many Indian states. Most states came under British rule. Much of the collection dates from between the post-Mutiny re-organisation of the Indian Government and Indian Independence in 1947. Some items published in London by John Murray. |
|---|---|
| Shelfmark | India Papers |