

Medicine - Disease > Cholera in southern India
(78) Page 54
Download files
Individual page:
Thumbnail gallery: Grid view | List view
54
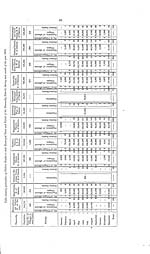
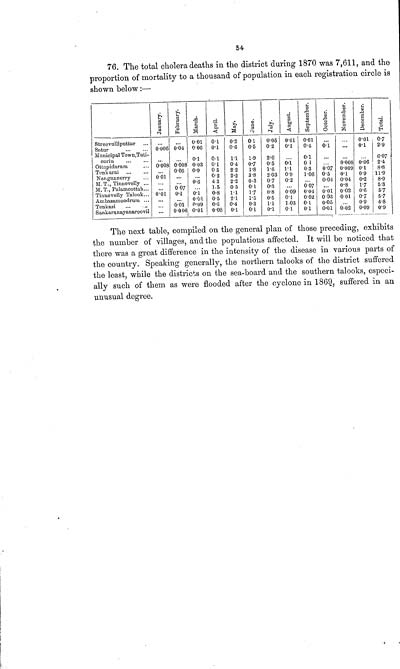
76. The total cholera deaths in the district during 1870 was 7,611, and the
proportion of mortality to a thousand of population in each registration circle is
shown below:-
January.
February.
March.
April.
May.
June.
July.
August.
September.
October.
November.
December.
Total.
Streevulliputtur ...
...
...
0.01
0.1
02
0.1
0.05
0.01
0.01
...
...
0.01
0.7
Satur ... ...
0.006
0.04
0.06
01
06
05
02
0.1
0.4
0.1
...
0.1
29
Municipal Town, Tuti.
corin ... ...
...
...
0.1
0.1
1.1
19
26
...
01
...
...
...
607
Ottapidaram ...
0.008
0.008
0.03
0.1
0.4
07
05
0.1
0.1
...
0.008
0.06
24
Tenkarai ... ...
...
0.05
09
0.5
22
18
16
1.1
03
0.07
0.009
0.1
88
Nangunnerry ...
0.01
...
...
02
22
38
2.03
0.9
106
0.5
01
09
119
M. T., Tinnevelly ...
...
...
06
4.3
22
03
07
02
...
0.04
0.04
02
89
M. T., Palamcottah...
...
0. 07
...
1.5
0.5
0.1
03
...
0.07
...
0.8
17
53
Tinnevelly Talook...
0.01
0.1
0.1
08
1.1
1.7
08
0.09
0.04
0.01
0.02
06
5.7
Ambasamoodrum
...
...
0.01
05
21
15
05
01
0.02
0.03
0.01
07
5.7
Tenkasi ... ...
...
0.01
0.09
05
04
03
1.1
1.03
0.1
0.05
...
09
48
Sankaranayanarcovil
...
0.006
0.01
0.08
01
01
01
01
01
0.01
0.02
0.09
09
The next table, compiled on the general plan of those preceding, exhibits
the number of villages, and the populations affected. It will be noticed that
there was a great difference in the intensity of the disease in various parts of
the country. Speaking generally, the northern talooks of the district suffered
the least, while the districts on the sea-board and the southern talooks, especi-
ally such of them as were flooded after the cyclone in 1869, suffered in an
unusual degree.
Set display mode to: Large image | Zoom image | Transcription
Images and transcriptions on this page, including medium image downloads, may be used under the Creative Commons Attribution 4.0 International Licence unless otherwise stated. ![]()
| India Papers > Medicine - Disease > Cholera in southern India > (78) Page 54 |
|---|
| Permanent URL | https://digital.nls.uk/74534316 |
|---|
| Description | A record of the progress of cholera in 1870, and résumé of the records of former epidemic invasions of the Madras Presidency by W.R. Cornish. Extensive report gives context of cholera and describes cholera invasions of 1818, 1859-1969. 1870 cholera described in various districts plus influence of sanitation on cholera. Tables show mortality rates and rainfall. |
|---|---|
| Shelfmark | IP/25/PI.5 |
| Additional NLS resources: | |
| Description | The Disease collection consists of 51 volumes from British India, dating from 1868 to 1920. Official publications varying from short reports to multi-volume histories related to disease, public health and medical research. Focuses on cholera, leprosy, plague and malaria. |
|---|---|
| Description | The India Papers collection contains publications of the central (Imperial) Government and many Indian states. Most states came under British rule. Much of the collection dates from between the post-Mutiny re-organisation of the Indian Government and Indian Independence in 1947. Some items published in London by John Murray. |
|---|---|
| Shelfmark | India Papers |