

Medicine - Disease > Cholera in southern India
(77) Page 53
Download files
Individual page:
Thumbnail gallery: Grid view | List view
53
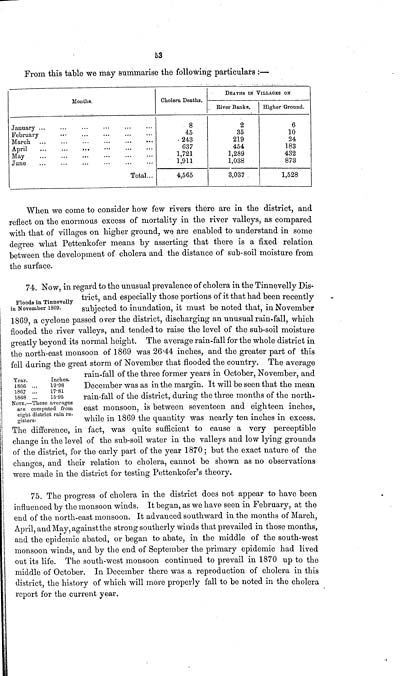
From this table we may summarise the following particulars :-
Months.
Cholera Deaths.
DEATHS IN VILLAGES ON
River Banks.
Higher Ground.
January
8
2
6
February
45
35
10
March
243
219
24
April
637
454
183
May
1,721
1,289
432
June
1,911
1,038
873
Total...
4,565
3,037
1,528
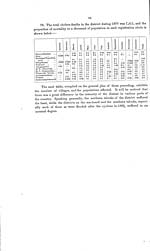
When we come to consider how few rivers there are in the district, and
reflect on the enormous excess of mortality in the river valleys, as compared
with that of villages on higher ground, we are enabled to understand in some
degree what Pettenkofer means by asserting that there is a fixed relation
between the development of cholera and the distance of sub-soil moisture from
the surface.
Floods in Tinnevelly
in November 1869.
Year. Inches.
1866 19.98
1867 17.81
1868 15.95
NOTE.-These averages
are computed from
eight district rain re-
gisters.
74. Now, in regard to the unusual prevalence of cholera in the Tinnevelly Dis-
trict, and especially those portions of it that had been recently
subjected to inundation, it must be noted that, in November
1869, a cyclone passed over the district, discharging an unusual rain-fall, which
flooded the river valleys, and tended to raise the level of the sub-soil moisture
greatly beyond its normal height. The average rain-fall for the whole district in
the north-east monsoon of 1869 was 26.44 inches, and the greater part of this
fell during the great storm of November that flooded the country. The average
rain-fall of the three former years in October, November, and
December was as in the margin. It will be seen that the mean
rain-fall of the district, during the three months of the north-
east monsoon, is between seventeen and eighteen inches,
while in 1869 the quantity was nearly ten inches in excess.
The difference, in fact, was quite sufficient to cause a very perceptible
change in the level of the sub-soil water in the valleys and low lying grounds
of the district, for the early part of the year 1870; but the exact nature of the
changes, and their relation to cholera, cannot be shown as no observations
were made in the district for testing Pettenkofer's theory.
75. The progress of cholera in the district does not appear to have been
influenced by the monsoon winds. It began, as we have seen in February, at the
end of the north-east monsoon. It advanced southward in the months of March,
April, and May, against the strong southerly winds that prevailed in those months,
and the epidemic abated, or began to abate, in the middle of the south-west
monsoon winds, and by the end of September the primary epidemic had lived
out its life. The south-west monsoon continued to prevail in 1870 up to the
middle of October. In December there was a reproduction of cholera in this
district, the history of which will more properly fall to be noted in the cholera
report for the current year.
From this table we may summarise the following particulars :-
Months.
Cholera Deaths.
DEATHS IN VILLAGES ON
River Banks.
Higher Ground.
January
8
2
6
February
45
35
10
March
243
219
24
April
637
454
183
May
1,721
1,289
432
June
1,911
1,038
873
Total...
4,565
3,037
1,528
When we come to consider how few rivers there are in the district, and
reflect on the enormous excess of mortality in the river valleys, as compared
with that of villages on higher ground, we are enabled to understand in some
degree what Pettenkofer means by asserting that there is a fixed relation
between the development of cholera and the distance of sub-soil moisture from
the surface.
Floods in Tinnevelly
in November 1869.
Year. Inches.
1866 19.98
1867 17.81
1868 15.95
NOTE.-These averages
are computed from
eight district rain re-
gisters.
74. Now, in regard to the unusual prevalence of cholera in the Tinnevelly Dis-
trict, and especially those portions of it that had been recently
subjected to inundation, it must be noted that, in November
1869, a cyclone passed over the district, discharging an unusual rain-fall, which
flooded the river valleys, and tended to raise the level of the sub-soil moisture
greatly beyond its normal height. The average rain-fall for the whole district in
the north-east monsoon of 1869 was 26.44 inches, and the greater part of this
fell during the great storm of November that flooded the country. The average
rain-fall of the three former years in October, November, and
December was as in the margin. It will be seen that the mean
rain-fall of the district, during the three months of the north-
east monsoon, is between seventeen and eighteen inches,
while in 1869 the quantity was nearly ten inches in excess.
The difference, in fact, was quite sufficient to cause a very perceptible
change in the level of the sub-soil water in the valleys and low lying grounds
of the district, for the early part of the year 1870; but the exact nature of the
changes, and their relation to cholera, cannot be shown as no observations
were made in the district for testing Pettenkofer's theory.
75. The progress of cholera in the district does not appear to have been
influenced by the monsoon winds. It began, as we have seen in February, at the
end of the north-east monsoon. It advanced southward in the months of March,
April, and May, against the strong southerly winds that prevailed in those months,
and the epidemic abated, or began to abate, in the middle of the south-west
monsoon winds, and by the end of September the primary epidemic had lived
out its life. The south-west monsoon continued to prevail in 1870 up to the
middle of October. In December there was a reproduction of cholera in this
district, the history of which will more properly fall to be noted in the cholera
report for the current year.
Set display mode to: Large image | Zoom image | Transcription
Images and transcriptions on this page, including medium image downloads, may be used under the Creative Commons Attribution 4.0 International Licence unless otherwise stated. ![]()
| India Papers > Medicine - Disease > Cholera in southern India > (77) Page 53 |
|---|
| Permanent URL | https://digital.nls.uk/74534314 |
|---|
| Description | A record of the progress of cholera in 1870, and résumé of the records of former epidemic invasions of the Madras Presidency by W.R. Cornish. Extensive report gives context of cholera and describes cholera invasions of 1818, 1859-1969. 1870 cholera described in various districts plus influence of sanitation on cholera. Tables show mortality rates and rainfall. |
|---|---|
| Shelfmark | IP/25/PI.5 |
| Additional NLS resources: | |
| Description | The Disease collection consists of 51 volumes from British India, dating from 1868 to 1920. Official publications varying from short reports to multi-volume histories related to disease, public health and medical research. Focuses on cholera, leprosy, plague and malaria. |
|---|---|
| Description | The India Papers collection contains publications of the central (Imperial) Government and many Indian states. Most states came under British rule. Much of the collection dates from between the post-Mutiny re-organisation of the Indian Government and Indian Independence in 1947. Some items published in London by John Murray. |
|---|---|
| Shelfmark | India Papers |