

Medicine - Institutions > Army health reports and medical documents > Scientific memoirs by officers of the Medical and Sanitary Departments of the Government of India > Number 46 - Malaria in the Punjab > Part II - Autumnal epidemic (fulminant) malaria
(23) Page 11
Download files
Individual page:
Thumbnail gallery: Grid view | List view
11
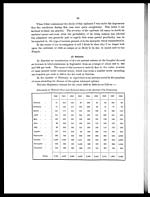
At Bhera dispensary the weekly admissions for malarial fevers rose from a
number never exceeding 50 to over 500 (vide Chart 2). Towards the end of the
epidemic most of the excess in admissions was due to cases attending for enlarge-
ment of the spleen. At Miani the number of admissions for malaria rose from
under 50 per week to nearly 700 per week.
(ii) Mortality.
The nature of the mortality curves for different areas will be apparent from
Chart 3.1 They show a sharp rise usually towards the end of September, a high
level maintained throughout October and part or the whole of November and
rates falling rapidly in December and January to normal. The resemblance of
the curve to that of the autumn epidemics previously referred to will be apparent.
It is remarkable that with the exception of the extreme south-east, where the
characteristic rise from mortality took place about a fortnight earlier than in
the northern part of the Punjab, places even hundreds of miles apart were
affected simultaneously.
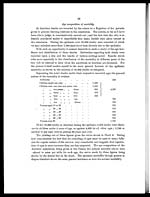
A comparison of the mortality curve with the dispensary records shows that
the two curves follow one another very closely. In the case of Amritsar the
admissions first began to be affected towards the end of August, but were not
seriously increased until the second week in September; the deaths were first
markedly increased in the fourth week in September. In the case of admissions
for sickness the numbers rose to its maximum in the week ending the 3rd
October and then declined rather rapidly. The death rate was highest in the week
ending 17th October. But the numbers of deaths continued comparatively much
higher than the admissions for sickness and did not decline until the end of
November, or about a month later than the fall in sickness rates.
At Bhera the first indication of an increase of sickness occurred in the fourth
week in August; the first indication of an increase of mortality was in the middle of
September. The admissions were highest in the first week of October and mortal-
ity in the third week.
At Miani sickness and mortality appeared almost coincidently, but the
admissions rose to their highest point in the last week of September, whilst the
greatest mortality was in the second week in October.
In the case of Bhera a second rise in the number of admissions occurred in-
dependently of in creased mortality reaching its maximum at the end of November.
In this town therefore the sickness outlasted the mortality (vide next section).
Roughly speaking the increase of mortality followed the increase in sickness
by about a fortnight.
1It will be found in a pocket at the end of the Memoir.
c2
Set display mode to: Large image | Zoom image | Transcription
Images and transcriptions on this page, including medium image downloads, may be used under the Creative Commons Attribution 4.0 International Licence unless otherwise stated. ![]()
| Permanent URL | https://digital.nls.uk/75058639 |
|---|
| Shelfmark | IP/QB.10 |
|---|---|
| Additional NLS resources: | |
| Description | 61 volume new series covers bacteriological research work from 1902-1913 by Indian Medical Service staff. Laboratory experiments are recorded in detail. Many are accompanied by illustrations showing microscopic views and features of plant and animal matter. (Calcutta : Supt. of Govt. Print., India, 1885-1901.) |
|---|---|
| Shelfmark | IP/QB.10 |
| Description | 12 titles describe the health and sanitary conditions of the army in India. Lists British, European and Indian troops plus families of military personnel. 3 volumes of army regulations included. 73 volumes make up the Scientific Memoirs series, a journal by Indian Medical Service staff. |
|---|---|
| Description | The Institutions collection consists of 106 volumes from British India, dating from the 1860's to the 1940's. Divided into reports on medical institutions, army health, and lock hospitals. Education of indigenous medical students and maintenance of troop health shown in annual reports and statistical tables. |
|---|---|
| Description | The India Papers collection contains publications of the central (Imperial) Government and many Indian states. Most states came under British rule. Much of the collection dates from between the post-Mutiny re-organisation of the Indian Government and Indian Independence in 1947. Some items published in London by John Murray. |
|---|---|
| Shelfmark | India Papers |