

Medicine - Disease > Cholera in India, 1862 to 1881
(21) Page 7
Download files
Individual page:
Thumbnail gallery: Grid view | List view
( 7 )
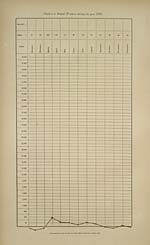
The strength of the affected jails is 14,672, the percentage of admissions
to strength 6.87, and of deaths to admission 33. Of the 1,007 admissions
there were 7 in January, 23 in February, 378 in March, 108 in April,
107 in May, 45 in June, 118 in July, 74 in August, 32 in September, 21 in
October, 56 in November, and 38 in December. Taking all the figures together
the monthly prevalence of the disease is shown on the accompanying diagram.
The districts affected with cholera are marked on the map.
Meteorology.
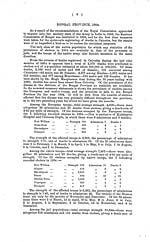
BENGAL PROVINCE, 1863.
The monthly Rainfall registered in inches and cents at one station in each district during the year
1863 is shewn in the subjoined tabular statement.
Divisions.
DISTRICTS.
RAINFALL REGISTEEED IN THE MONTHS OF 1863.
January.
February.
March.
April.
May.
June.
July
August.
September.
October.
November.
December.
Total
Burdwan...
Burdwan............
...
0.50
1.65
4.45
17.50
13.90
15.30
4.90
200
0.30
60.50
Bankara
...
0.50
0.40
4.35
12.70
11.70
12.60
9.30
3.65
0.40
55.60
Beerbhum* (Suri)......
0.41
0.92
0.81
0.81
2.48
8.40
13.03
12.34
9.33
4.41
0.13
0.14
53.21
Midnapore
...
.
3.98
13.00
9.50
11.40
7.60
0.90
1.40
47.78
Hooghli*............
0.64
1.78
2.38
3.86
5.33
10.77
12.76
12.28
8.54
4.20
0.48
0.17
63.19
Howrah*
0.42
1.77
3.02
2.42
3.73
13.56
12.14
12.24
10.70
5.43
0.40
0.13
65.96
Presidency
24-Pergunnahs (Alipore)
0.39
1.43
1.63
2.48
4.77
11.25
12.50
11.41
8.89
6.87
0.02
0.12
61.76
Calcutta (Observatory)
...
1.20
...
2.43
4.20
12.93
11.22
14.10
10.33
3.48
1.26
61.15
Nuddea (Kishnagarh)......
...
6.20
8.60
10.20
11.10
8.20
1.70
46.00
Jessore*
0.35
0.64
1.72
4.09
6.90
12.88
1044
11.09
9.12
6.03
0.70
0.06
64.02
Rajshahye
Mursbidabad (Berhampore).
0.65
...
3.40
4.30
13.50
7.45
11.60
5.09
185
0.10
47.94
Dinagepore
5.80
26.20
20.00
10.20
20.50
13.90
...
96.60
Maldah............
0.25
...
1.32
3.78
5.18
6.60
12.90
10.14
0.65
40.82
Rajshahye (Rampore Baulia)
...
.
7.40
1390
14.40
9.30
14.60
.
59.60
Rungpore*............
0.36
0.35
0.99
3.24
9.34
22.58
17.86
12.90
12.23
5.30
0 28
0.13
85.56
Bogra............
...
.
10.60
5.90
17.60
18.30
16.40
13.00
2.50
84.30
Pubna*............
0.34
1.19
1.43
5.52
7.87
12.52
11.86
11.02
12.03
4.91
0.49
0.02
69.20
Kuch Behar
Darjiling*
0.50
1.27
1.60
4.38
6.42
26.53
28.19
25.97
17.73
8.45
0.20
0.10
121.34
Julpaiguri*
0.50
0.39
2.03
4.66
8.59
29.61
25.86
24.95
27.31
7.09
0.02
0.02
131.03
Dacca
Dacca...............
0.17
...
9.62
8.38
7.74
21.42
5.41
3.41
56.15
Furridpore*............
0.58
1.46
2.04
6.69
10.58
13.69
11.90
11.42
9.62
4.52
0.46
0.01
72.97
Backergunpre* (Barisal)......
0.47
1.23
1.44
2.89
7.03
11.50
15.24
13.14
11.01
5.27
0.29
0.23
69.74
Mymensirg*.........
0.31
1.36
1.33
7.43
12.04
22.45
18.43
14.61
13.48
5.04
0.10
0.06
96.64
Chittagong
Chittagong*.........
0.28
1.31
1.32
4.84
9.05
22.14
21.33
20.91
13.09
6.85
1.68
0.47
103.27
Noakholli
.
.
6.14
8.08
18.44.
10.64
17.68
13.75
8.23
82.96
Tipperah (Comillah)......
...
0.05
...
17.40
10.40
13.25
16.85
19.30
5.25
3.85
0.10
...
86.45
Patna
Patna*............
0.59
0.71
0.31
0.41
0.97
6.66
10.97
7.46
7.26
2.54
0.07
0.06
38.01
Gya*.........
0.81
0 63
0.55
0.50
0.73
6.53
12.49
10.52
6.83
2.89
0.04
0.07
42.59
Shahabad (Arrah)......
0.92
0.02
...
1.05
0.30
18.11
10.87
26.37
3.55
61.19
Tirhut {Muzanfferpore......
...
4.00
8.60
16.40
2.50
31.50
{Durbhanga*
0.30
0.26
0.50
0.79
1.18
8.02
16.11
9.00
12.14
1.79
...
0.10
50.19
Sarun (Chaprah).........
0.55
0.16
...
1.65
0.55
3.97
14.86
16.62
14.60
3.30
...
56.26
Chumparun (Motihari) ,......
0.30
...
...
2.00
1.40
6.20
14.10
23.90
9.00
...
...
...
56.90
Bhagulpore
Mongbyr............
0.70
0.90
0.65
3.55
6.95
10.90
14.80
2.00
0.40
.
40.85
Bhngulpore ...........
...
.
1.90
1.60
5.20
10.56
11 10
11.90
42.26
Purneah*............
0.39
0.65
0.31
2.45
1.57
12.17
15.64
13.35
15.94
4.41
0.07
66.95
Sonthal * (Nya Dumka)
0.09
0.94
0.97
1.02
3.36
8.86
14.39
12.27
10.75
3.27
0.01
0.04
55.97
Orissa
Cuttack............
1.50
20.90
17.95
15.60
7.10
2.00
65.05
Poori
...
3.60
0.60
2.10
7.30
4.50
13.25
15.30
7.80
6.45
...
60.90
Balasore
...
5.20
0.30
4.90
33.80
5.20
10.75
14.95
7.70
4.00
86.80
Chota Nagpur
Hazaribagh*.........
0.31
0.71
0.70
0.44
1.14
8.12
14.32
14.13
8.57
369
021
0.06
52.40
Lohardugga.........
...
...
7.70
16.85
3.10
4.55
32.20
Singbhum* (Chaibasa)......
0.52
0.92
1.58
1.18
2.43
7.48
11.99
11.43
10.28
4.13
0.19
0.16
52.29
Manbhum* (Purulia)......
0.42
0.79
0.83
0.95
1.25
8.79
9.37
10.85
7.08
4.33
0.09
0.18
44.93
Monthly Totals
11.70
32.76
28.99
134.41
209.90
543.51
583.20
609.38
477.42
167.04
20.27
2.40
2,820.98
Quarterly Totals
73.45
887.82
1,670.00
189.71
Monthly averages
0.27
0.74
0.66
3.06
4.77
12.35
13.25
13.85
10.85
3.80
0.46
0.05
64.11
Quarterly averages
1.67
20.18
37.95
4.31
* Average-from Report on Food-grain Supply and Statistical Review of the Relief Operations in the Distressed -Districts of Behar
and Bengal during the Famine of 1873-74 by A. P. MacDonnell, of the Bengal Civil Service.
'From- Report of the Commissioners appointed to enquire into the Famine in Bengal and Orissa in 1866.
Alipore, average of 5 years, 1871 to 1875.
Cuttack, from Report of the Commissioners appointed to enquire into the Famine -in Bengal and Orissa in 1866.
The strength of the affected jails is 14,672, the percentage of admissions
to strength 6.87, and of deaths to admission 33. Of the 1,007 admissions
there were 7 in January, 23 in February, 378 in March, 108 in April,
107 in May, 45 in June, 118 in July, 74 in August, 32 in September, 21 in
October, 56 in November, and 38 in December. Taking all the figures together
the monthly prevalence of the disease is shown on the accompanying diagram.
The districts affected with cholera are marked on the map.
Meteorology.
BENGAL PROVINCE, 1863.
The monthly Rainfall registered in inches and cents at one station in each district during the year
1863 is shewn in the subjoined tabular statement.
Divisions.
DISTRICTS.
RAINFALL REGISTEEED IN THE MONTHS OF 1863.
January.
February.
March.
April.
May.
June.
July
August.
September.
October.
November.
December.
Total
Burdwan...
Burdwan............
...
0.50
1.65
4.45
17.50
13.90
15.30
4.90
200
0.30
60.50
Bankara
...
0.50
0.40
4.35
12.70
11.70
12.60
9.30
3.65
0.40
55.60
Beerbhum* (Suri)......
0.41
0.92
0.81
0.81
2.48
8.40
13.03
12.34
9.33
4.41
0.13
0.14
53.21
Midnapore
...
.
3.98
13.00
9.50
11.40
7.60
0.90
1.40
47.78
Hooghli*............
0.64
1.78
2.38
3.86
5.33
10.77
12.76
12.28
8.54
4.20
0.48
0.17
63.19
Howrah*
0.42
1.77
3.02
2.42
3.73
13.56
12.14
12.24
10.70
5.43
0.40
0.13
65.96
Presidency
24-Pergunnahs (Alipore)
0.39
1.43
1.63
2.48
4.77
11.25
12.50
11.41
8.89
6.87
0.02
0.12
61.76
Calcutta (Observatory)
...
1.20
...
2.43
4.20
12.93
11.22
14.10
10.33
3.48
1.26
61.15
Nuddea (Kishnagarh)......
...
6.20
8.60
10.20
11.10
8.20
1.70
46.00
Jessore*
0.35
0.64
1.72
4.09
6.90
12.88
1044
11.09
9.12
6.03
0.70
0.06
64.02
Rajshahye
Mursbidabad (Berhampore).
0.65
...
3.40
4.30
13.50
7.45
11.60
5.09
185
0.10
47.94
Dinagepore
5.80
26.20
20.00
10.20
20.50
13.90
...
96.60
Maldah............
0.25
...
1.32
3.78
5.18
6.60
12.90
10.14
0.65
40.82
Rajshahye (Rampore Baulia)
...
.
7.40
1390
14.40
9.30
14.60
.
59.60
Rungpore*............
0.36
0.35
0.99
3.24
9.34
22.58
17.86
12.90
12.23
5.30
0 28
0.13
85.56
Bogra............
...
.
10.60
5.90
17.60
18.30
16.40
13.00
2.50
84.30
Pubna*............
0.34
1.19
1.43
5.52
7.87
12.52
11.86
11.02
12.03
4.91
0.49
0.02
69.20
Kuch Behar
Darjiling*
0.50
1.27
1.60
4.38
6.42
26.53
28.19
25.97
17.73
8.45
0.20
0.10
121.34
Julpaiguri*
0.50
0.39
2.03
4.66
8.59
29.61
25.86
24.95
27.31
7.09
0.02
0.02
131.03
Dacca
Dacca...............
0.17
...
9.62
8.38
7.74
21.42
5.41
3.41
56.15
Furridpore*............
0.58
1.46
2.04
6.69
10.58
13.69
11.90
11.42
9.62
4.52
0.46
0.01
72.97
Backergunpre* (Barisal)......
0.47
1.23
1.44
2.89
7.03
11.50
15.24
13.14
11.01
5.27
0.29
0.23
69.74
Mymensirg*.........
0.31
1.36
1.33
7.43
12.04
22.45
18.43
14.61
13.48
5.04
0.10
0.06
96.64
Chittagong
Chittagong*.........
0.28
1.31
1.32
4.84
9.05
22.14
21.33
20.91
13.09
6.85
1.68
0.47
103.27
Noakholli
.
.
6.14
8.08
18.44.
10.64
17.68
13.75
8.23
82.96
Tipperah (Comillah)......
...
0.05
...
17.40
10.40
13.25
16.85
19.30
5.25
3.85
0.10
...
86.45
Patna
Patna*............
0.59
0.71
0.31
0.41
0.97
6.66
10.97
7.46
7.26
2.54
0.07
0.06
38.01
Gya*.........
0.81
0 63
0.55
0.50
0.73
6.53
12.49
10.52
6.83
2.89
0.04
0.07
42.59
Shahabad (Arrah)......
0.92
0.02
...
1.05
0.30
18.11
10.87
26.37
3.55
61.19
Tirhut {Muzanfferpore......
...
4.00
8.60
16.40
2.50
31.50
{Durbhanga*
0.30
0.26
0.50
0.79
1.18
8.02
16.11
9.00
12.14
1.79
...
0.10
50.19
Sarun (Chaprah).........
0.55
0.16
...
1.65
0.55
3.97
14.86
16.62
14.60
3.30
...
56.26
Chumparun (Motihari) ,......
0.30
...
...
2.00
1.40
6.20
14.10
23.90
9.00
...
...
...
56.90
Bhagulpore
Mongbyr............
0.70
0.90
0.65
3.55
6.95
10.90
14.80
2.00
0.40
.
40.85
Bhngulpore ...........
...
.
1.90
1.60
5.20
10.56
11 10
11.90
42.26
Purneah*............
0.39
0.65
0.31
2.45
1.57
12.17
15.64
13.35
15.94
4.41
0.07
66.95
Sonthal * (Nya Dumka)
0.09
0.94
0.97
1.02
3.36
8.86
14.39
12.27
10.75
3.27
0.01
0.04
55.97
Orissa
Cuttack............
1.50
20.90
17.95
15.60
7.10
2.00
65.05
Poori
...
3.60
0.60
2.10
7.30
4.50
13.25
15.30
7.80
6.45
...
60.90
Balasore
...
5.20
0.30
4.90
33.80
5.20
10.75
14.95
7.70
4.00
86.80
Chota Nagpur
Hazaribagh*.........
0.31
0.71
0.70
0.44
1.14
8.12
14.32
14.13
8.57
369
021
0.06
52.40
Lohardugga.........
...
...
7.70
16.85
3.10
4.55
32.20
Singbhum* (Chaibasa)......
0.52
0.92
1.58
1.18
2.43
7.48
11.99
11.43
10.28
4.13
0.19
0.16
52.29
Manbhum* (Purulia)......
0.42
0.79
0.83
0.95
1.25
8.79
9.37
10.85
7.08
4.33
0.09
0.18
44.93
Monthly Totals
11.70
32.76
28.99
134.41
209.90
543.51
583.20
609.38
477.42
167.04
20.27
2.40
2,820.98
Quarterly Totals
73.45
887.82
1,670.00
189.71
Monthly averages
0.27
0.74
0.66
3.06
4.77
12.35
13.25
13.85
10.85
3.80
0.46
0.05
64.11
Quarterly averages
1.67
20.18
37.95
4.31
* Average-from Report on Food-grain Supply and Statistical Review of the Relief Operations in the Distressed -Districts of Behar
and Bengal during the Famine of 1873-74 by A. P. MacDonnell, of the Bengal Civil Service.
'From- Report of the Commissioners appointed to enquire into the Famine in Bengal and Orissa in 1866.
Alipore, average of 5 years, 1871 to 1875.
Cuttack, from Report of the Commissioners appointed to enquire into the Famine -in Bengal and Orissa in 1866.
Set display mode to: Large image | Zoom image | Transcription
Images and transcriptions on this page, including medium image downloads, may be used under the Creative Commons Attribution 4.0 International Licence unless otherwise stated. ![]()
| India Papers > Medicine - Disease > Cholera in India, 1862 to 1881 > (21) Page 7 |
|---|
| Permanent URL | https://digital.nls.uk/74533610 |
|---|---|
| Description | Bengal Province, 1863 |
| Description | Bengal Province, 1862 to 1881, and review. Describes outbreaks of cholera in districts of Bengal. Includes observations from medical staff, charts and statistical tables. 1872 census figures shown at front. |
|---|---|
| Shelfmark | IP/6/SB.4 |
| Additional NLS resources: | |
| Description | The Disease collection consists of 51 volumes from British India, dating from 1868 to 1920. Official publications varying from short reports to multi-volume histories related to disease, public health and medical research. Focuses on cholera, leprosy, plague and malaria. |
|---|---|
| Description | The India Papers collection contains publications of the central (Imperial) Government and many Indian states. Most states came under British rule. Much of the collection dates from between the post-Mutiny re-organisation of the Indian Government and Indian Independence in 1947. Some items published in London by John Murray. |
|---|---|
| Shelfmark | India Papers |