Medicine - Disease > Cholera in India, 1862 to 1881
(17) Page 5
Download files
Individual page:
Thumbnail gallery: Grid view | List view

( 5 )
were 6 in January, 5 in February, 55 in March, 157 in April, 14 in May, 11 in
June, 26 in July, 36 in August, 13 in September, 22 in October, 17 in Novem-
ber, and 5 in December.
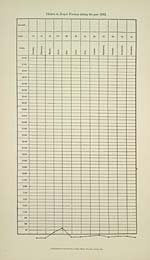
Taking all the figures together, the monthly prevalence of the disease
is shown on the accompanying diagram. On the map are marked the districts
shown to be affected with cholera in 1862 :-
Meteorology.-
BENGAL PROVINCE, 1862.
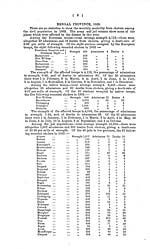
The monthly Rainfall registered in inches and cents at one station in each district during the
year 1862 is shewn in the subjoined tabular statement.
Divisions.
DISTRICTS.
RAINFALL REGISTERED IN ?H? MONTHS OF 1862.
January.
February.
March.
April.
May.
June.
July.
August.
September.
October.
November.
December.
Total.
Burdwan
Burdwan ......
0.40
0.70
7.70
5.40
15.00
18.65
5.50
7.70
12.65
0.30
74.00
Bankoora.........
0.80
0.20
2.70
2.00
1030
22.10
7.65
5.00
11.05
61.80
Beerbhoom* (Suri)
0.41
092
0.81
0.81
2.48
8.40
13.03
12.34
9.33
4.41
0.13
0.14
53.21
Midnapore....
4.81
2.03
2.81
3.85
15.63
21.32
10.84
5.95
11.70
78.44
Hooghly*........
0.64
1.78
2.38
3.86
5.33
10.77
12.76
12.28
8.54
4.20
0.48
0.17
63.19
Howrah*........
0.42
1.77
3.02
2.42
3.73
13.56
12.14
12.24
10.70
5.43
0.40
0.13
65.96
Presi- dency
24-Pergunnahs (Alipore)
0.39
1.43
1.63
2.48
4.77
11.25
12.50
11.41
8.89
6.87
0.02
0.12
61.76
Calcutta (Observatory)..
1.03
1.69
2.53
3.80
13.63
13.31
12.03
10.86
14.40
.
0.20
73.48
Nuddea* (Krishnagurh)..
0.51
1.11
0.87
3.82
6.98
10.66
9.72
9.43
7.40
4.50
0.31
0.14
55.45
Jessore........
0.50
...
1.60
8.20
12.60
18.70
11.20
11.70
7.50
19.20
...
0.30
91.50
Rajshahye
Moorshedabad (Berham-
pore).
0.20
0.90
4.40
3.70
6.05
9.00
7.35
8.40
15.05
55.05
Dinagepore.........
4.50
7.70
5.10
1.30
7.80
37.50
5.20
69.10
Maldah.........
0.10
...
1.28
0.65
5.60
10.82
5.12
9.52
11.50
6.53
...
51.12
Rajshahye (Rampore Beau
leah).
0.50
...
6.50
1.90
6.20
23.90
8.90
6.60
6.90
15.70
...
77.10
Rungpore.........
.
1.20
5.45
11.30
17.20
0.50
6.90
18.10
9.00
69.65
Bogra*.........
0.48
1.25
0.81
4.73
8.92
16.31
18.41
12.03
14.72
5.72
1.15
0.10
84.63
Pubna*.........
0.34
1.19
1.43
5.52
7.87
12.52
11.86
11.02
12.03
4.91
0.49
0.02
69.20
Coosh
Behar
Darjeeling*.........
0.50
1.27
1.60
4.38
6.42
26.53
28.19
25.97
17.73
8.45
0.20
0.10
121.34
Julpigoree*.........
0.50
0.39
2.03
4.66
8.59
29.61
25.86
24.95
27.31
7.09
0.02
0.02
131.03
Dacca
Dacca.........
0.34
0.18
1.18
9.99
13.82
14.32
8.50
16.93
9.24
18.86
0.55
93.91
Furreedpore*......
0.58
1.46
2.04
6.69
10.58
13.69
11.90
11.42
9.62
4.52
0.46
0.01
72.97
Backergunge* (Barisal)...
0.47
1.23
1.44
2.89
7.03
11.50
15.24
13.14
11.01
5.27
0.29
0.23
69 74
Mymensingh*......
0.31
1.36
1.33
7.43
12.04
22.45
18.43
14.60
13.48
5.04
0.10
0.06
96.64
Chitta- gong
Chittagong*......
0.28
1.31
1.32
4.84
9.05
22.14
21.33
20.91
13.09
6.85
1.68
0.47
103.27
Noakholly.........
1.77
6.69
11.54
14.76
17.20
11.04
13.80
0.20
77.00
Tipperah (Comillah)
2.85
...
3.50
18.35
11.90
20.15
4.95
21.90
13.05
15.50
0.10
112.25
Patna
Patna*.........
0.59
0.71
0.31
0.41
0.97
6.66
10.97
7.46
7.26
2.54
0.07
0.06
38.01
Gya*......
0.81
0.63
0.55
0.50
0.73
6.53
12.49
10.52
6.83
2.89
0.04
0.07
42.59
Shahabad (Arrah)
0.72
...
1.92
......
0.80
3.20
1765
18.67
2.52
1.30
.
41.78
Tirhoot (Mozufferpore.
0.70
8.30
11.10
4.60
2.80
28.00
Durbhunga*...
0.30
0.26
0.57
0.79
1.18
8.02
16.11
9.00
12.14
1.79
0.10
50.20
Sarun (Chuprah)
1.60
0.50
1.75
5.72
5.12
6.52
3.00
3.66
27.87
Chumparun (Motihari)...
1.50
6.50
4.30
8.10
11.70
7.40
1.30
40.80
Bhagulpore
Monghyr
0.85
0.40
0.95
9.20
8.00
9.80
4.15
7.10
40.45
Bhagulpore.........
1.00
0.52
2.70
6.75
7.57
13.30
8.10
11.20
51.14
Purneah*........
0.39
0.65
0.31
2.45
1.57
12.17
15.64
13.35
15.94
4.41
0.07
66.95
Sonthal (Nya Dumka)...
0.09
0.94
0.97
1.02
3.36
8.86
14.39
12.27
10.75
3.27
0.01
0.04
55.97
Orissa
Cuttack......
0.85
1.67
7.90
17.07
11.90
13.33
52.81
Pooree ........
0.80
2.10
21.30
18.70
34.40
16.60
42.20
136.10
Balasore........
3.70
...
1.80
0.70
2.20
10.00
17.20
11.60
35.40
29.30
...
...
111.90
Chota
Nagpur
Hazaribagh*......
0.31
0.71
0.70
0.44
1.14
8.12
14.32
14.13
8.57
3.69
0.21
0.06
52.40
Lohardugga (Ranchi)
0.60
1.70
6.00
6.00
11.60
6.60
3.70
36.20
Singbhoom (Chyebassa)...
0.52
0.92
1.58
1.18
2.43
7.48
11.99
11.43
10.28
4.13
0.19
0.16
52.29
Manbhoom (Purulia)
0.42
0.79
0.83
0.95
1.25
8.79
9.37
10.85
7.08
4.33
0.09
0.18
44.93
Monthly Total
27.93
22.26
56.72
134.27
221.35
533.63
552.50
563.44
495.80
384.84
6.34
4.10
3,003.18
Quarterly Total...
106.91
889.25
1611.74
395.28
Monthly averages
0.63
051
1.29
3.05
5.03
12.13
12.56
12.80
11.27
8.75
0.14
0.09
68.25
Quarterly averages
2.43
20.21
36.63
8.98
* Average-from Report on Food-grain Supply and Statistical Review of the Relief Operations in the Distressed Districts
of Behar and Bengal during the Famine of 1873-74 by A. P. MucDonnell, of the Bengal Civil Service.
t Average of five years-1871 to 1875-Alipore.
Pooree-from Report of the Commissioners appointed to enquire into the Famine in Bengal and Orissa in 1866.
Set display mode to: Large image | Zoom image | Transcription
Images and transcriptions on this page, including medium image downloads, may be used under the Creative Commons Attribution 4.0 International Licence unless otherwise stated. ![]()
| India Papers > Medicine - Disease > Cholera in India, 1862 to 1881 > (17) Page 5 |
|---|
| Permanent URL | https://digital.nls.uk/74533602 |
|---|---|
| Description | Bengal Province, 1862 |


