Series 3 > Scottish population statistics, including Webster's Analysis of population, 1755
(37) Page xxx
Download files
Complete book:
Individual page:
Thumbnail gallery: Grid view | List view

XXX
WEBSTER’S CENSUS
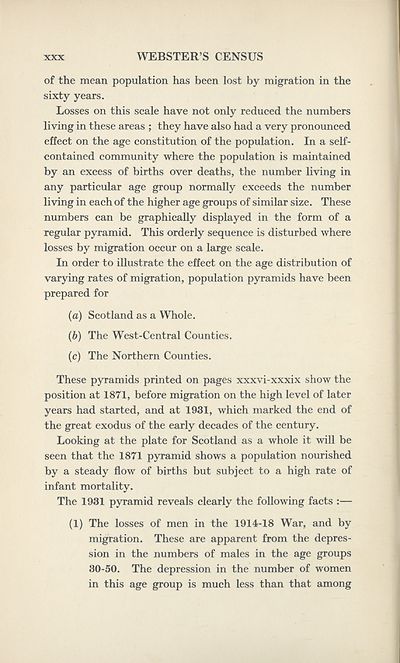
of the mean population has been lost by migration in the
sixty years.
Losses on this scale have not only reduced the numbers
living in these areas ; they have also had a very pronounced
effect on the age constitution of the population. In a self-
contained community where the population is maintained
by an excess of births over deaths, the number living in
any particular age group normally exceeds the number
living in each of the higher age groups of similar size. These
numbers can be graphically displayed in the form of a
regular pyramid. This orderly sequence is disturbed where
losses by migration occur on a large scale.
In order to illustrate the effect on the age distribution of
varying rates of migration, population pyramids have been
prepared for
(a) Scotland as a Whole.
(b) The West-Central Counties.
(c) The Northern Counties.
These pyramids printed on pages xxxvi-xxxix show the
position at 1871, before migration on the high level of later
years had started, and at 1931, which marked the end of
the great exodus of the early decades of the century.
Looking at the plate for Scotland as a whole it will be
seen that the 1871 pyramid shows a population nourished
by a steady flow of births but subject to a high rate of
infant mortality.
The 1931 pyramid reveals clearly the following facts :—
(1) The losses of men in the 1914-18 War, and by
migration. These are apparent from the depres¬
sion in the numbers of males in the age groups
30-50. The depression in the number of women
in this age group is much less than that among
Set display mode to:
![]() Universal Viewer |
Universal Viewer | ![]() Mirador |
Large image | Transcription
Mirador |
Large image | Transcription
Images and transcriptions on this page, including medium image downloads, may be used under the Creative Commons Attribution 4.0 International Licence unless otherwise stated. ![]()
| Scottish History Society volumes > Series 3 > Scottish population statistics, including Webster's Analysis of population, 1755 > (37) Page xxx |
|---|
| Permanent URL | https://digital.nls.uk/126796335 |
|---|
| Attribution and copyright: |
|
|---|
| Description | Over 180 volumes, published by the Scottish History Society, containing original sources on Scotland's history and people. With a wide range of subjects, the books collectively cover all periods from the 12th to 20th centuries, and reflect changing trends in Scottish history. Sources are accompanied by scholarly interpretation, references and bibliographies. Volumes are usually published annually, and more digitised volumes will be added as they become available. |
|---|


