Series 3 > Scottish population statistics, including Webster's Analysis of population, 1755
(28) Page xxi
Download files
Complete book:
Individual page:
Thumbnail gallery: Grid view | List view
INTRODUCTION
xxi
Table II
1861-1871
1871-1881
1881-1891
1891-1901
1901-1911
1911-1921
1921-1931
1931-1951
542843
360180
352386
Intercensal
Increase in
Population
297724
375555
290074
446456
288801
121593
-39517
252989
Net
Migration
Loss
217418
53356
254042
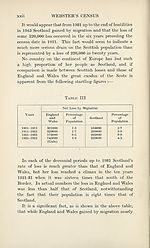
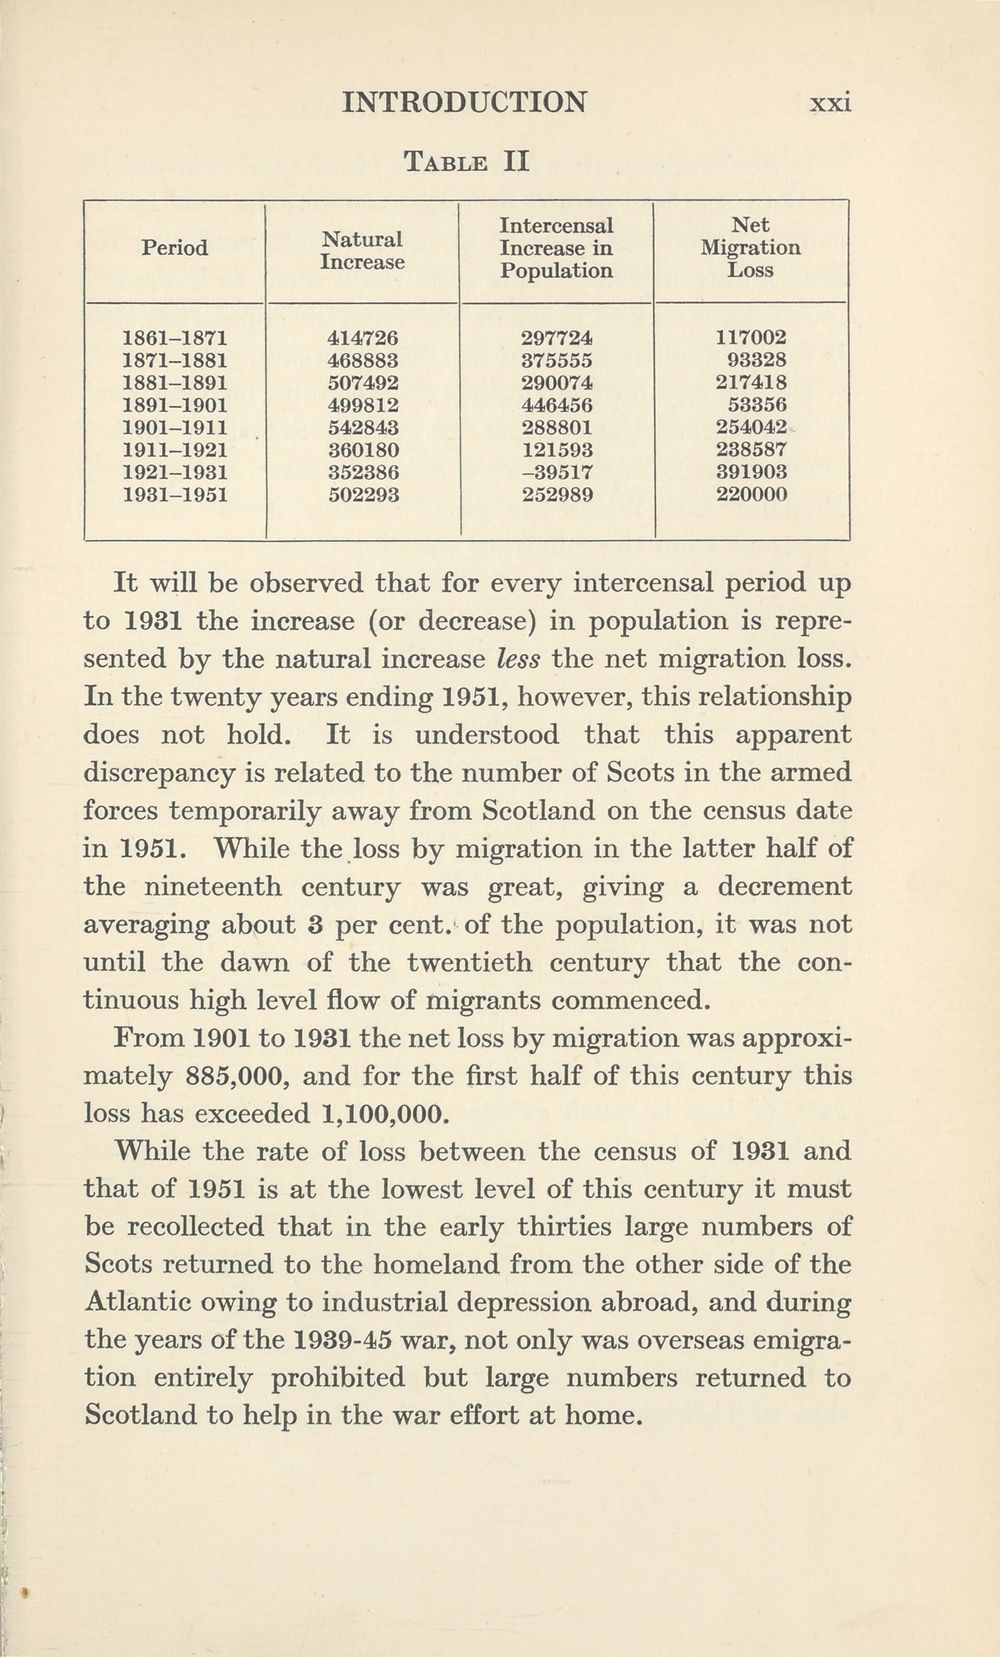
It will be observed that for every intercensal period up
to 1931 the increase (or decrease) in population is repre¬
sented by the natural increase less the net migration loss.
In the twenty years ending 1951, however, this relationship
does not hold. It is understood that this apparent
discrepancy is related to the number of Scots in the armed
forces temporarily away from Scotland on the census date
in 1951. While the loss by migration in the latter half of
the nineteenth century was great, giving a decrement
averaging about 3 per cent, of the population, it was not
until the dawn of the twentieth century that the con¬
tinuous high level flow of migrants commenced.
From 1901 to 1931 the net loss by migration was approxi¬
mately 885,000, and for the first half of this century this
loss has exceeded 1,100,000.
While the rate of loss between the census of 1931 and
that of 1951 is at the lowest level of this century it must
be recollected that in the early thirties large numbers of
Scots returned to the homeland from the other side of the
Atlantic owing to industrial depression abroad, and during
the years of the 1939-45 war, not only was overseas emigra¬
tion entirely prohibited but large numbers returned to
Scotland to help in the war effort at home.
xxi
Table II
1861-1871
1871-1881
1881-1891
1891-1901
1901-1911
1911-1921
1921-1931
1931-1951
542843
360180
352386
Intercensal
Increase in
Population
297724
375555
290074
446456
288801
121593
-39517
252989
Net
Migration
Loss
217418
53356
254042
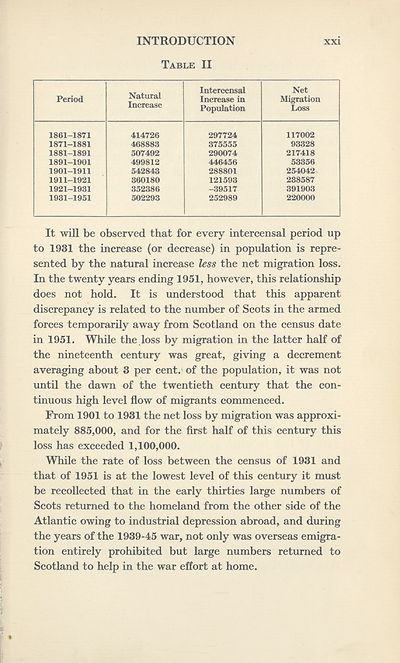
It will be observed that for every intercensal period up
to 1931 the increase (or decrease) in population is repre¬
sented by the natural increase less the net migration loss.
In the twenty years ending 1951, however, this relationship
does not hold. It is understood that this apparent
discrepancy is related to the number of Scots in the armed
forces temporarily away from Scotland on the census date
in 1951. While the loss by migration in the latter half of
the nineteenth century was great, giving a decrement
averaging about 3 per cent, of the population, it was not
until the dawn of the twentieth century that the con¬
tinuous high level flow of migrants commenced.
From 1901 to 1931 the net loss by migration was approxi¬
mately 885,000, and for the first half of this century this
loss has exceeded 1,100,000.
While the rate of loss between the census of 1931 and
that of 1951 is at the lowest level of this century it must
be recollected that in the early thirties large numbers of
Scots returned to the homeland from the other side of the
Atlantic owing to industrial depression abroad, and during
the years of the 1939-45 war, not only was overseas emigra¬
tion entirely prohibited but large numbers returned to
Scotland to help in the war effort at home.
Set display mode to:
![]() Universal Viewer |
Universal Viewer | ![]() Mirador |
Large image | Transcription
Mirador |
Large image | Transcription
Images and transcriptions on this page, including medium image downloads, may be used under the Creative Commons Attribution 4.0 International Licence unless otherwise stated. ![]()
| Scottish History Society volumes > Series 3 > Scottish population statistics, including Webster's Analysis of population, 1755 > (28) Page xxi |
|---|
| Permanent URL | https://digital.nls.uk/126796227 |
|---|
| Description | By James Gray Kyd. |
|---|---|
| Shelfmark | SCS.SHS.125 |
| Additional NLS resources: | |
| Attribution and copyright: |
|
| Attribution and copyright: |
|
|---|
| Description | Over 180 volumes, published by the Scottish History Society, containing original sources on Scotland's history and people. With a wide range of subjects, the books collectively cover all periods from the 12th to 20th centuries, and reflect changing trends in Scottish history. Sources are accompanied by scholarly interpretation, references and bibliographies. Volumes are usually published annually, and more digitised volumes will be added as they become available. |
|---|