Download files
Complete book:
Individual page:
Thumbnail gallery: Grid view | List view
— 334 —
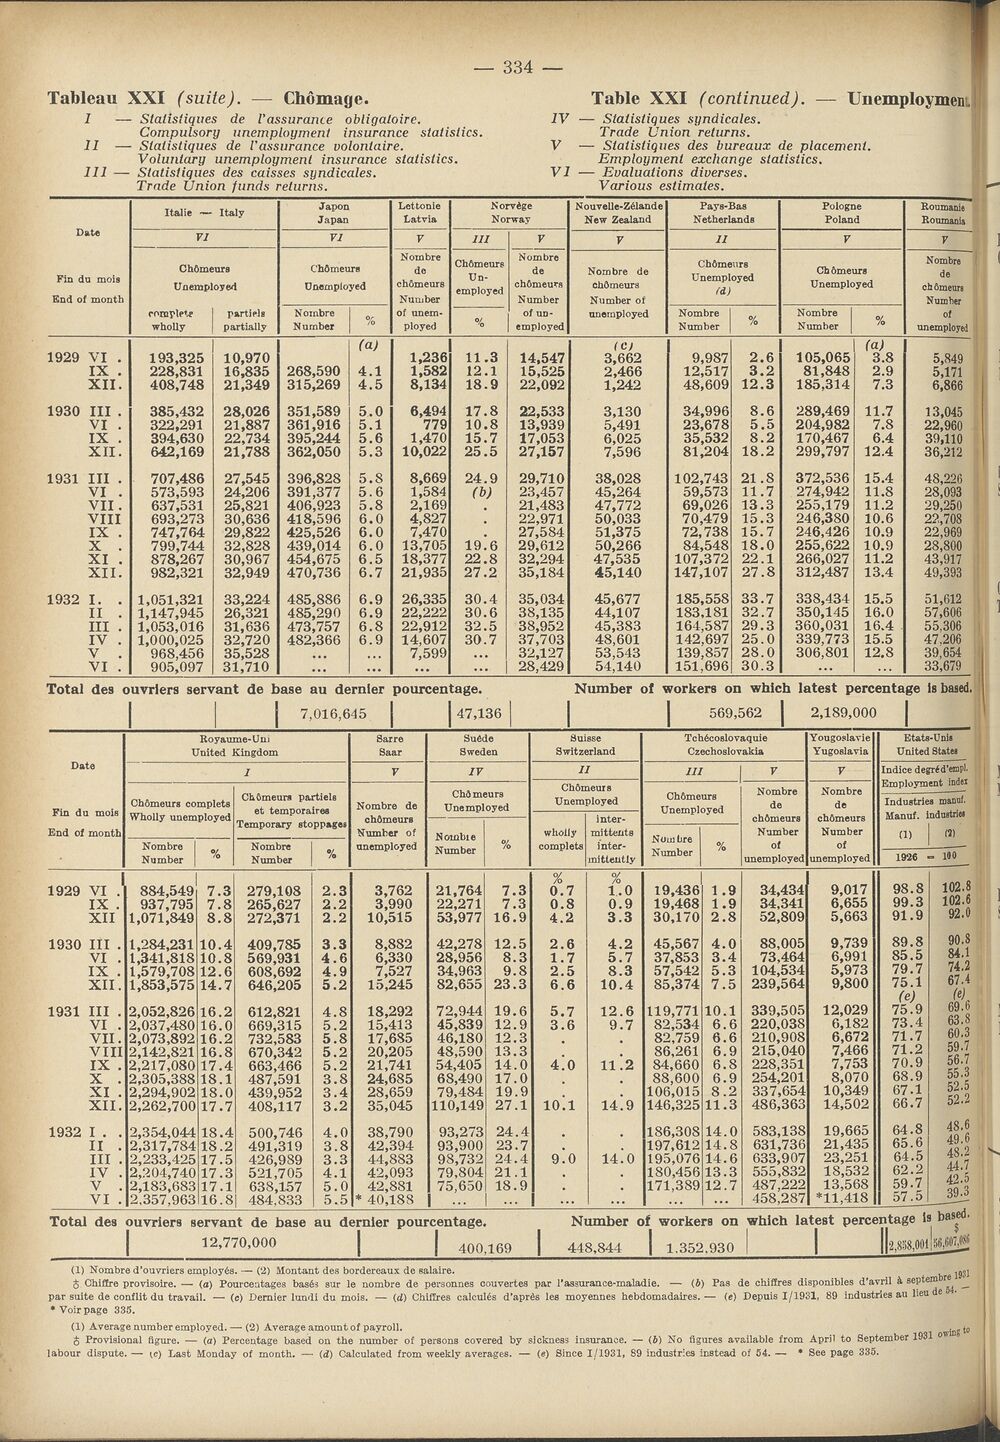
Tableau XXI
I
(suite).
Chomage.
Slatistiques de Vassurance obligaloire.
Compulsory unemployment insurance statistics.
Slalistiques de I’assurance volontaire.
Voluntary unemployment insurance statistics.
Ill — Statistiques des caisses syndicates.
Trade Union funds returns.
Table XXI (continued). — Unemploymen
n
IV — Statistiques syndicates.
Trade Union returns.
V — Slalistiques des bureaux de placement.
Employment exchange statistics.
VI — Evaluations diverses.
Various estimates.
Fin du mois
End of month
Italic —- Italy
Ch6meurs
Unemployed
complete
wholly
partiels
partially
Japon
Japan
Chdmeurs
Unemployed
Nornbre
N umber
Lettonie
Latvia
Nombre
de
chomeurs
Number
of unem¬
ployed
N orv^ge
Norway
Ch6meure
Un¬
employed
Nombre
de
ch6meucs
Number
of un¬
employed
Nouvelle-Z61and e
New Zealand
Nombre de
chdmeurs
Number of
unemployed
Pays-Bas
Netherlands
Chdmenrs
Unemployed
fd)
Nombre
Number
Pologne
Poland
Ch omeurs
Unemployed
%
Houmanie
Roumania
ch dmeurs
Number
1929 vi .
ix .
XII.
193,325
228,831
408,748
1930 III
VI
IX
XII.
385,432
322,291
394,630
642,169
1931 III
VI
VII.
VIII
IX .
X .
XI .
XII.
707,486
573,593
637,531
693,273
747,764
799,744
878,267
982,321
1932
I.
II
III
IV
V
VI
1,051,321
1,147,945
1,053,016
1,000,025
968,456
905,097
10,970
16,835
21,349
(a)
268,590
315,269
4.1
4.5
1,236
1,582
8,134
11.3
12.1
18.9
28,026
21,887
22,734
21,788
351,589
361,916
395,244
362,050
5.0
5.1
5.6
5.3
6,494
779
1,470
10,022
17.8
10.8
15.7
25.5
27,545
24,206
25.821
30,636
29.822
32,828
30,967
32,949
396,828
391,377
406,923
418,596
425,526
439,014
454,675
470,736
5.8
5.6
5.8
6.0
6.0
6.0
6.5
6.7
8,669
1,584
2,169
4,827
7,470
13,705
18,377
21,935
24.9
(b)
19.6
22.8
27.2
33,224
26,321
31,636
32,720
35,528
31,710
485,886
485,290
473,757
482,366
6.9
6.9
6.8
6.9
26,335
22,222
22,912
14,607
7,599
30.4
30.6
32.5
30.7
14,547
15,525
22,092
(C)
3,662
2,466
1,242
9,987
12,517
48,609
22,533
13,939
17,053
27,157
3,130
5,491
6,025
7,596
34,996
23,678
35,532
81,204
29,710
23,457
21,483
22,971
27,584
29,612
32,294
35,184
38,028
45,264
47,772
50,033
51,375
50,266
47,535
45,140
102,743
59,573
69,026
70,479
72,738
84,548
107,372
147,107
35,034
38,135
38,952
37,703
32,127
28,429
45,677
44,107
45,383
48,601
53,543
54,140
185,558
183,181
164,587
142,697
139,857
151,696
2.6
3.2
12.3
105,065
81,848
185,314
8.6
5.5
8.2
18.2
289,469
204,982
170,467
299,797
21.8
11.7
13.3
15.3
15.7
18.0
22.1
27.8
372,536
274,942
255,179
246,380
246,426
255,622
266,027
312,487
33.7
32.7
29.3
25.0
28.0
30.3
338,434
350,145
360,031
339,773
306,801
(a)
3.8
2.9
7.3
5,849
5,171
6,866
11.7
7.8
6.4
12.4
13,045
22,960
39,110
36,212
15.4
11.8
11.2
10.6
10.9
10.9
11.2
13.4
48,226
28,093
29,250
22,708
22,969
28,800
43,917
49,393
15.5
16.0
16.4
15.5
12.8
51,612
57,606
55,306
47,206
39,654
33,679
I 1
Total des ouvrlers servant de base an dernier pourcentage.
I 7,016,645 I I 47,136
Number of workers on which latest percentage Is based.
569,562 I 2,189,000
Fin du mois
End of month
1929 VI .
IX .
XII
1930 III
VI
IX .
XII.
1931 III
VI
VII.
VIII
IX
X
XI
XII.
1932
I .
II
III
IV
V
VI
Royaume-Uni
United Kingdom
Chdmeurs complets
Wholly unemployed
Nombre
Number
Chdmeum partiels
et temporaires
Temporary stoppages
Nombre
Number
884,549
937,795
1,071,849
1,284,231
1,341,818
1,579,708
1,853,575
2,052,826
2,037,480
2,073,892
2,142,821
2,217,080
2,305,388
2,294,902
2,262,700
2,354,044
2,317,784
2,233,425
2,204,740
2,183,683
2,357,963
7.3
7.8
8.8
10.4
10.8
12.6
14.7
16.2
16.0
16.2
16.8
17.4
18.1
18.0
17.7
18.4
18.2
17.5
17.3
17.1
16.8|
279,108
265,627
272,371
409,785
569,931
608,692
646,205
612,821
669,315
732,583
670,342
663,466
487,591
439,952
408,117
500,746
491,319
426,989
521,705
638,157
484,833
2.3
2.2
2.2
3.3
4.6
4.9
5.2
4.8
5.2
5.8
5.2
5.2
3.8
3.4
3.2
4.0
3.8
3.3
4.1
5.0
5.5
Sarre
Saar
Nombre de
chdmeurs
Number of
unemployed
3,762
3,990
10,515
8,882
6,330
7,527
15,245
18,292
15,413
17.685
20,205
21,741
24.685
28,659
35,045
38,790
42,394
44,883
42,093
42,881
40,188
Sufide
Sweden
Chi meurs
Unemployed
Suisse
Switzerland
Chdmeuis
Unemployed
wholly
complets
21,764
22,271
53,977
42,278
28,956
34,963
82,655
72,944
45,839
46,180
48,590
54,405
68,490
79,484
110,149
93,273
93,900
98,732
79,804
75,650
7.3
7.3
16.9
12.5
8.3
9.8
23.3
19.6
12.9
12.3
13.3
14.0
17.0
19.9
27.1
24.4
23.7
24.4
21.1
18.9
%
0.7
0.8
4.2
2.6
1.7
2.5
6.6
5.7
3.6
4.0
io!i
9.0
inter-
mittents
inter¬
mittently
%
1.0
0.9
3.3
4.2
5.7
8.3
10.4
12.6
9.7
11.2
14!9
14.0
Tchdcoslovaquie
Czechoslovakia
Chdmeurs
Unemployed
Norn bre
N umber
19,436
19,468
30,170
45,567
37,853
57,542
85,374
119,771
82,534
82,759
86,261
84,660
88,600
106,015
146,325
186,308
197,612
195,076
180,456
171,389
1.9
1.9
2.8
4.0
3.4
5.3
7.5
14.0
14.8
14.6
13.3
12.7
Nombre
de
chdmeurs
Number
of
unemployed
34,434
34,341
52,809
88,005
73,464
104,534
239,564
339,505
220,038
210,908
215,040
228,351
254,201
337,654
486,363
583,138
631,736
633,907
555,832
487,222
458,287
Yougoslavie
Yugoslavia
Nombre
de
chdmeurs
Number
of
unemployed
9,017
6,655
5,663
9,739
6,991
5,973
9,800
12,029
6,182
6,672
7,466
7,753
8,070
10,349
14,502
19,665
21,435
23,251
18,532
13,568
*11,418
Etats-Unis
United States
Indice degrtd'empl.
Employment isdei
Industries manuf-
Manuf. industriw
100
98.8
99.3
91.9
89.8
85.5
79.7
75.1
(e)
75.9
73.4
71.7
71.2
70.9
68.9
67.1
66.7
64.8
65.6
64.5
62.2
59.7
57.5
102.8
102.6
92.0
90.8
84.1
74.2
67.4
W
69.6
63.8
60.3
59.7
56.7
55.3
52.5
52.2
48.6
49.6
48.2
44.7
42.5
39.3
Total des ouvriers servant de base an dernier pourcentage.
12,770,000 I I 400169
Number of workers on which latest percentage is
448,844
1.352.930
| > 0.001! 56,607,*
(1) Nombre d’ouvriers employes. — (2) Montant des bordereaux de salaire. jg31
$ Chiffre provisoire. — (a) Pourceatages basds sur le nombre de personnes couvertes par I’assurance-maladie. — (b) Pas de chiffres disponibles d’avril & septem ^
par suite de conflit du travail. — (c) Dernier lundi du mois. — (d) Chiffres calculus d'aprds lea moyennes hebdomadaires.— (e) Depuis 1/1931, 89 industries an lieu de
* Voir page 335.
(1) Average number employed. — (2) Average amount of payroll. ^
$ Provisional figure. — (a) Percentage based on the number of persons covered by sickness insurance. — (b) No figures available from April to September 1931 o'*
labour dispute. — <c) Last Monday of month. — (d) Calculated from weekly averages. — (e) Since 1/1931, 89 industries instead of 54. — * See page 335.
—i
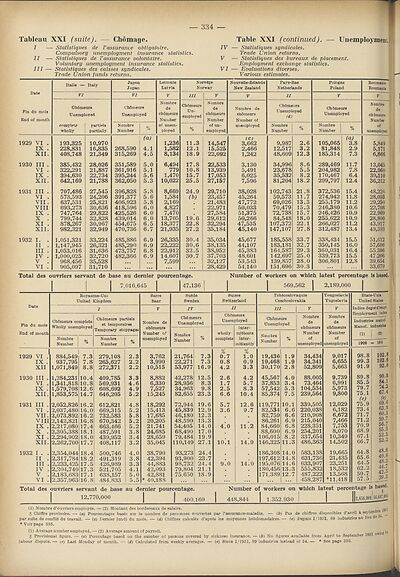
Set display mode to:
![]() Universal Viewer |
Universal Viewer | ![]() Mirador |
Large image | Transcription
Mirador |
Large image | Transcription
Images and transcriptions on this page, including medium image downloads, may be used under the Creative Commons Attribution 4.0 International Licence unless otherwise stated. ![]()
| League of Nations > Background to the League > Monthly bulletin of statistics > 1932 > (342) |
|---|
| Permanent URL | https://digital.nls.uk/194971183 |
|---|
| Attribution and copyright: |
|
|---|---|
| Shelfmark | LN.14 |
|---|---|
| Description | Over 1,200 documents from the non-political organs of the League of Nations that dealt with health, disarmament, economic and financial matters for the duration of the League (1919-1945). Also online are statistical bulletins, essential facts, and an overview of the League by the first Secretary General, Sir Eric Drummond. These items are part of the Official Publications collection at the National Library of Scotland. |
|---|---|
| Additional NLS resources: |
|