Download files
Complete book:
Individual page:
Thumbnail gallery: Grid view | List view
\\ x
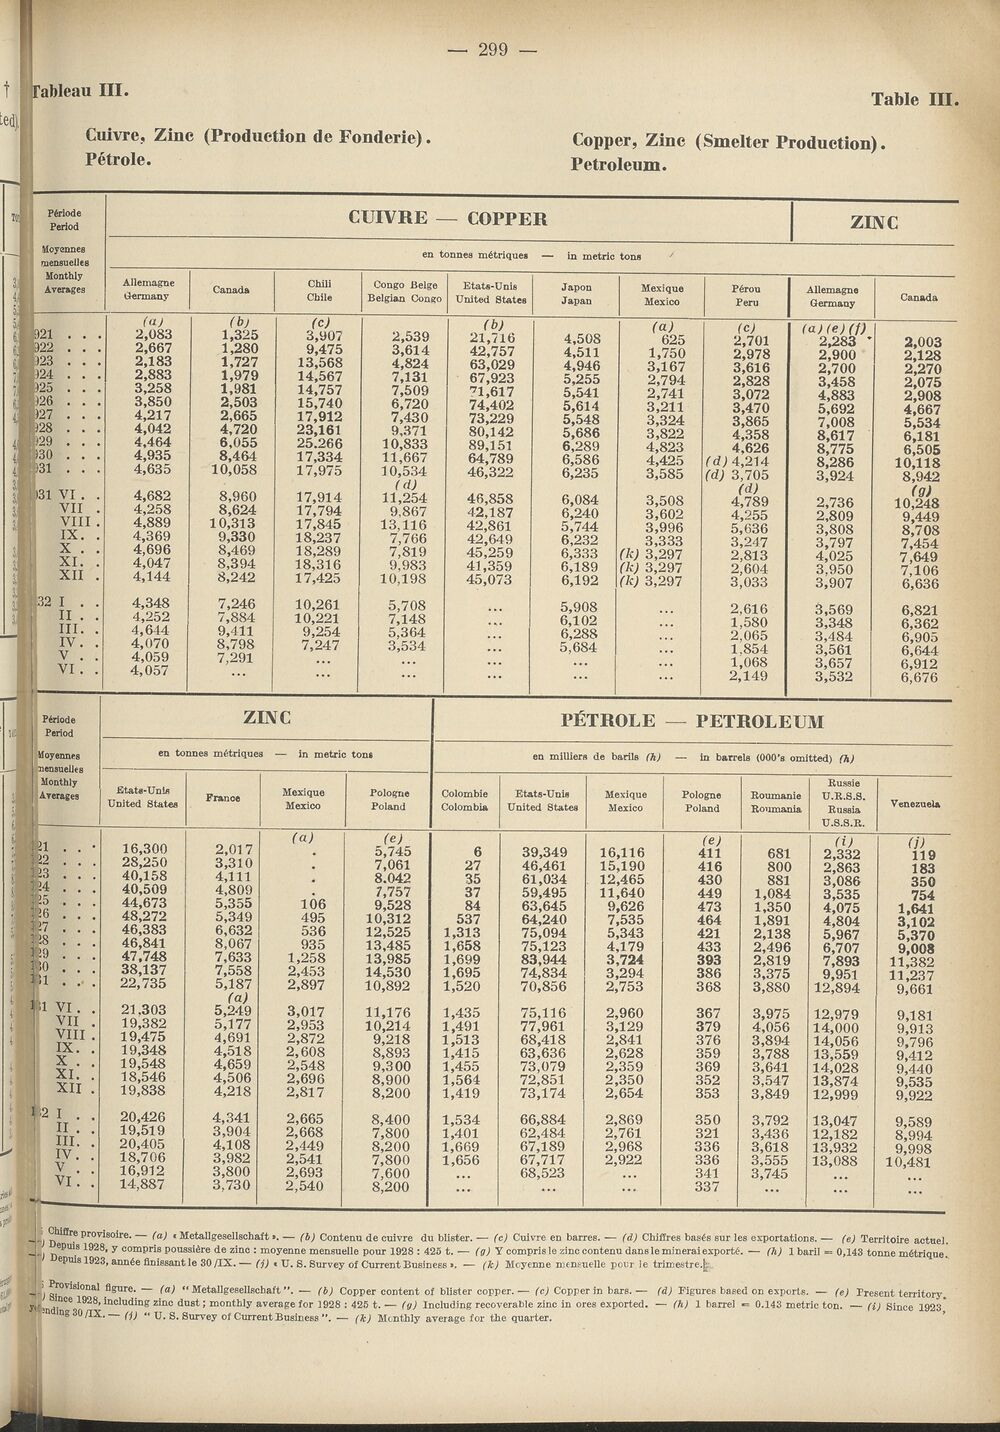
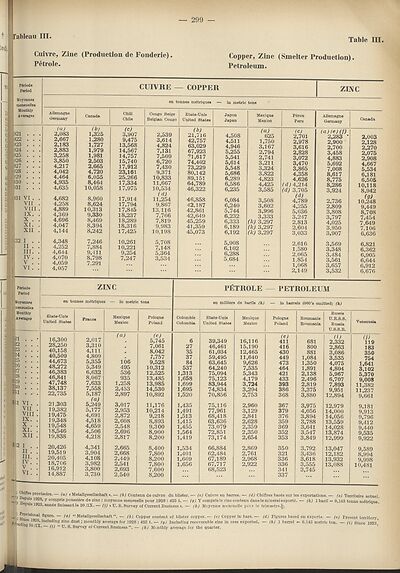
— 299 —
t Tableau III.
Table III.
Cuivre, Zinc (Production de Fonderie).
Petrole.
Copper, Zinc (Smelter Production).
Petroleum.
Period e
Period
Moyennee
mensuelles
Monthly
Averages
CUIVRE — COPPER
ZINC
en tonnes m6triques — in metric tons
Canada
4,682
4,258
4,889
4,369
4,696
4,047
4,144
4,348
4,252
4,644
4,070
4,059
4,057
(bj
1,325
1,280
1,727
1,979
1,981
2,503
2,665
4,720
6,055
8,464
10,058
8,960
8,624
10,313
9,330
8,469
8,394
8,242
7,246
7,884
9,411
8,798
7,291
Chili
Chile
(C)
3,907
9,475
13,568
14,567
14,757
15,740
17,912
23,161
25.266
17,334
17,975
17,914
17,794
17,845
18,237
18,289
18,316
17,425
10,261
10,221
9,254
7,247
Congo Beige
Belgian Congo
Etats-Unis
United States
2,539
3,614
4,824
7,131
7,509
6,720
7,430
9,371
10,833
11,667
10,534
(d)
11,254
9,867
13,116
7,766
7,819
9,983
10,198
5,708
7,148
5,364
3,534
(b)
21,716
42,757
63,029
67,923
’’l.ei?
74,402
73,229
80,142
89,151
64,789
46,322
46,858
42,187
42,861
42,649
45,259
41,359
45,073
Japon
Japan
4,508
4,511
4,946
5,255
5,541
5,614
5,548
5,686
6,289
6,586
6,235
6,084
6,240
5,744
6,232
6,333
6,189
6,192
5,908
6,102
6,288
5,684
Mexique
Mexico
I’orou
Peru
(a)
625
1,750
3,167
2,794
2,741
3,211
3,324
3.822
4.823
4,425
3,585
3,508
3,602
3,996
3,333
(k) 3,297
(k) 3,297
(k) 3,297
(c)
2,701
2,978
3.616
2,828
3,072
3,470
3,865
4,358
4,626
(d) 4,214
(d) 3,705
(d)
4,789
4,255
5,636
3,247
2,813
2,604
3,033
2.616
1,580
2,065
1.854
1,068
2,149
Allemagne
Germany
2,283
2,900
2,700
3,458
4,883
5,692
7,008
8,617
8,775
8,286
3,924
2,736
2,809
3,808
3,797
4,025
3,950
3,907
3,569
3,348
3,484
3,561
3,657
3,532
2,003
2,128
2,270
2,075
2,908
4,667
5,534
6,181
6,505
10,118
8,942
(a)
10,248
9,449
8,708
7,454
7,649
7,106
6,636
6,821
6,362
6,905
6,644
6,912
6,676
P6riode
Period
doyennes
nensueiJes
Monthly
Averages
ZINC
en tonnes m^triques — in metric tons
fitata-Unis
United States
Mexique
Mexico
Pologne
Poland
PETROLE — PETROLEUM
en milliers de barils (h) — in barrels (000’s omitted) (h)
Colombie
Colombia
16,300
28,250
40,158
40,509
44,673
48,272
46,383
46,841
47,748
38,137
22,735
21.303
19,382
19,475
19,348
19,548
18,546
19,838
20,426
19,519
20,405
18,706
16,912
14,887
2,017
3,310
4,111
4,809
5,355
5,349
6.632
8,067
7.633
7,558
5,187
(a)
5,249
5,177
4,691
4,518
4,659
4,506
4,218
4,341
3,904
4,108
3,982
3,800
3,730
(a)
106
495
536
935
1,258
2,453
2,897
3,017
2,953
2,872
2,608
2,548
2,696
2,817
2,665
2,668
2,449
2,541
2,693
2,540
(e)
5,745
7,061
8.042
7,757
9,528
10,312
12,525
13,485
13,985
14,530
10,892
11,176
10,214
9,218
8,893
9,300
8,900
8,200
8,400
7,800
8,200
7,800
7,600
8,200
6
27
35
37
84
537
1,313
1,658
1,699
1,695
1,520
1,435
1,491
1,513
1,415
1,455
1,564
1,419
1,534
1,401
1,669
1,656
Etats-Unis
United States
39,349
46,461
61,034
59,495
63,645
64,240
75,094
75,123
83,944
74,834
70,856
75,116
77,961
68,418
63,636
73,079
72,851
73,174
66,884
62,484
67,189
67,717
68,523
Mexique
Mexico
16,116
15,190
12,465
11,640
9,626
7,535
5,343
4,179
3,724
3,294
2,753
2,960
3,129
2,841
2,628
2,359
2,350
2,654
2,869
2,761
2,968
2,922
Pologne
Poland
Boumanie
Boumania
(e)
411
416
430
449
473
464
421
433
393
386
368
367
379
376
359
369
352
353
350
321
336
336
341
337
681
800
881
1,084
1,350
1,891
2,138
2,496
2,819
3,375
3,880
3,975
4,056
3,894
3,788
3,641
3,547
3,849
3,792
3,436
3,618
3,555
3,745
Kussie
U.R.S.S.
Russia
U.S.S.R.
d)
2,332
2,863
3,086
3,535
4,075
4,804
5,967
6,707
7,893
9,951
12,894
12,979
14,000
14,056
13,559
14,028
13,874
12,999
13,047
12,182
13,932
13,088
(!)
119
183
350
754
1,641
3,102
5,370
9,008
11,382
11,237
9,661
9,181
9,913
9,796
9,412
9,440
9,535
9,922
9,589
8,994
9,998
10,481
||| ^ .e Provi80H*e* (a) « Metallgesellschaft». — (b) Contenu de cuivre du blister. — (c) Cuivre en barres. — (d) Chiffres bas£s sur les exportations. — (e) Territoire actuel.
-v'l r)ePUi-8 y comPri8 pousstere de zinc : moyenne mensuelle pour 1928 : 425 t. — (g) Y comprisle zinc contenu dans le mineral exports. — (h) 1 baril «= 0,143 tonne m6trique.
fcpuis 1923, ann6e finissant le 30/IX. — (j) * U. S. Survey of Current Business ». — (k) Mcyenne mensuelle pour le trimestre.^,.
i ©visional figure. — (a) “Metallgesellschaft”. — (b) Copper content of blister copper. — (c) Copper in bars. — (d) Figures based on exports. — (e) Present territory.
*«» H,nCe ^nc^u^11^ z*nc dust; monthly average for 1928 : 425 t. — (g) Including recoverable zinc in ores exported,
mg 30/IX. ()) •* U. S. Survey of Current Business ”. — (k) Monthly average for the quarter
(h) 1 barrel *= 0.143 metric ton.
(i) Since 1923,
Set display mode to:
![]() Universal Viewer |
Universal Viewer | ![]() Mirador |
Large image | Transcription
Mirador |
Large image | Transcription
Images and transcriptions on this page, including medium image downloads, may be used under the Creative Commons Attribution 4.0 International Licence unless otherwise stated. ![]()
| League of Nations > Background to the League > Monthly bulletin of statistics > 1932 > (307) |
|---|
| Permanent URL | https://digital.nls.uk/194970728 |
|---|
| Attribution and copyright: |
|
|---|---|
| Shelfmark | LN.14 |
|---|---|
| Description | Over 1,200 documents from the non-political organs of the League of Nations that dealt with health, disarmament, economic and financial matters for the duration of the League (1919-1945). Also online are statistical bulletins, essential facts, and an overview of the League by the first Secretary General, Sir Eric Drummond. These items are part of the Official Publications collection at the National Library of Scotland. |
|---|---|
| Additional NLS resources: |
|