Download files
Complete book:
Individual page:
Thumbnail gallery: Grid view | List view
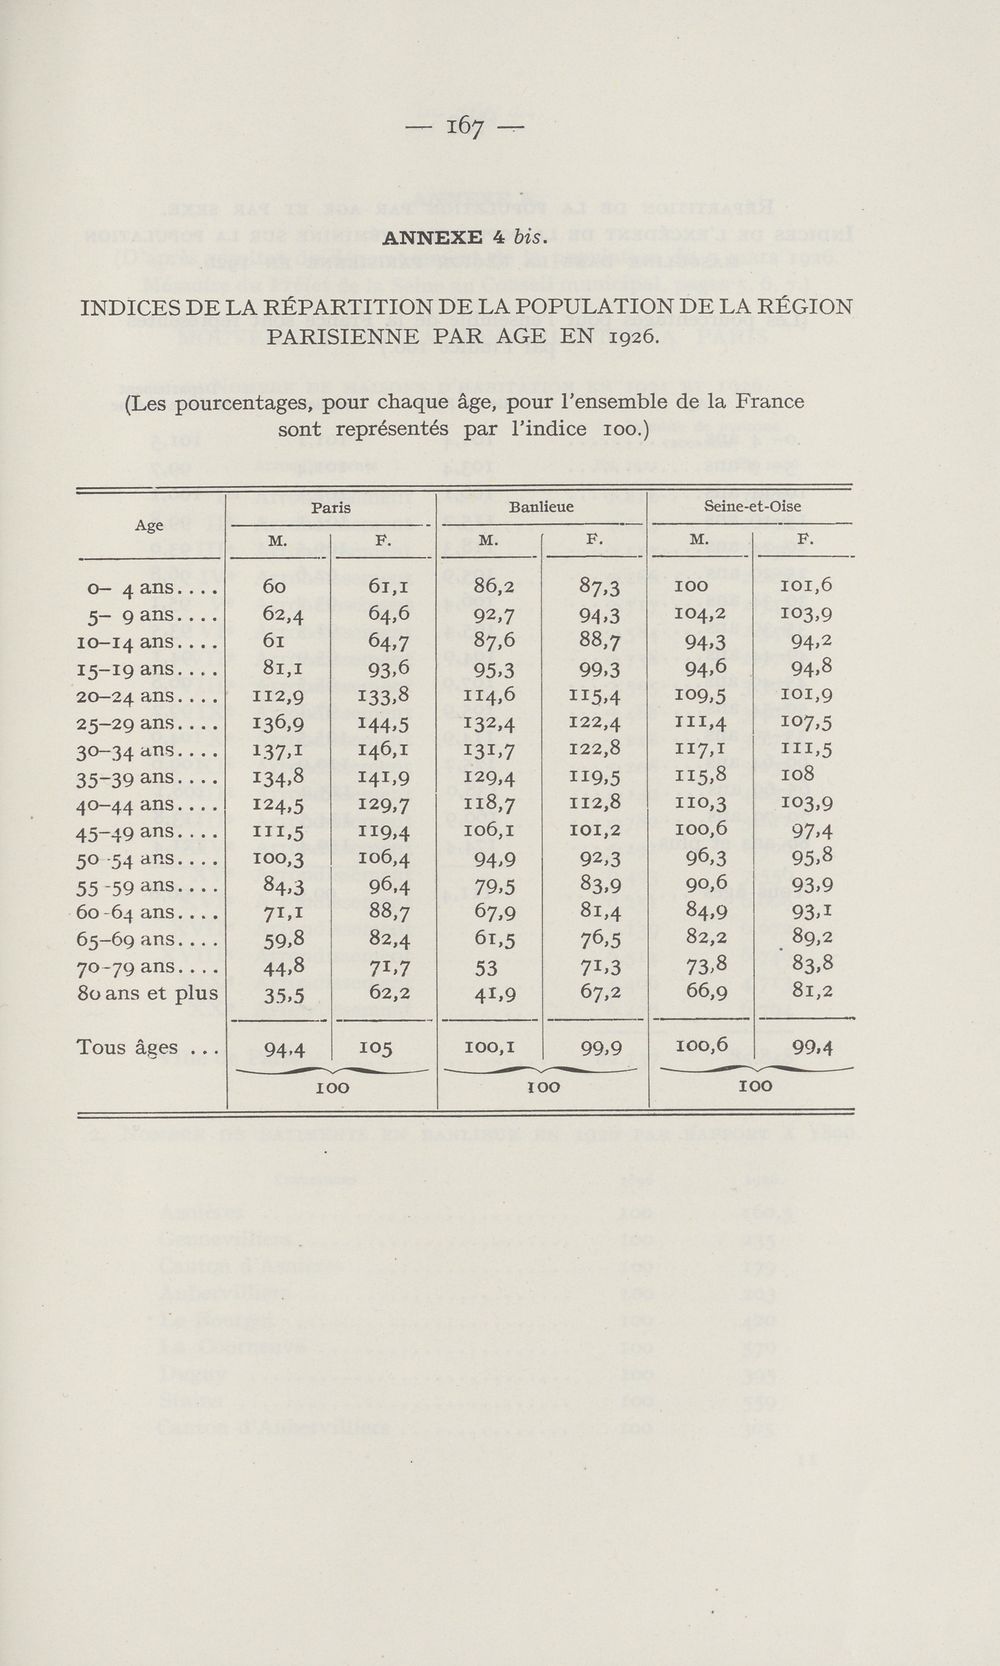
— 167 —
ANNEXE 4 bis.
INDICES DE LA REPARTITION DE LA POPULATION DE LA REGION
PARISIENNE PAR AGE EN 1926.
(Les pourcentages, pour chaque age, pour Tensemble de la France
sont representes par 1’indice 100.)
Age
o— 4 3,ns. .
5- 9 ans..
10-14 ans..
15-19 ans. .
20-24 ans..
25-29 ans. .
30-34 ans..
35-39 ans. .
40-44 ans..
45-49 ans. .
50 54 ans..
55-59 ans..
60 64 ans. .
65-69 ans. .
70-79 ans. .
80 ans et plus
Tous ages . ..
Paris
60
62.4
61
81.1
112.9
136.9
137.1
134.8
124.5
in,5
100,3
84,3
71.1
59.8
44.8
35.5
94-4
F.
61.1
64.6
64.7
93.6
133.8
144,5
146,1
141.9
129,7
H9,4
106,4
96.4
88.7
82.4
7L7
62.2
105
Banlieue
86.2
92,7
87,6
95.3
114.6
132.4
131.7
129.4
118.7
106,1
94.9
79.5
67.9
61.5
53
41.9
100,1
F.
87.3
94.3
88,7
99.3
H5,4
122,4
122.8
H9,5
112.8
101,2
92.3
83,9
81.4
76.5
7i,3
67,2
99,9
Seine-et-Oise
104.2
94.3
94.6
109.5
111,4
117,1
115,8
110.3
100.6
96.3
90.6
84,9
82,2
73.8
66.9
100,6
101,6
103.9
94,2
94.8
101.9
107,5
m,5
108
103.9
97,4
95.8
93.9
93.1
89.2
' 83,8
81.2
99.4
100
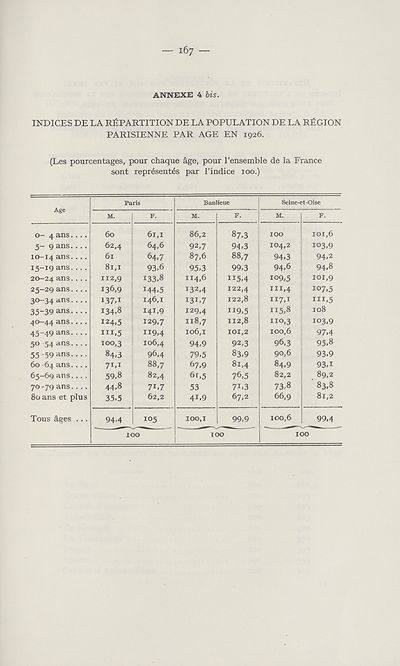
Set display mode to:
![]() Universal Viewer |
Universal Viewer | ![]() Mirador |
Large image | Transcription
Mirador |
Large image | Transcription
Images and transcriptions on this page, including medium image downloads, may be used under the Creative Commons Attribution 4.0 International Licence unless otherwise stated. ![]()
| League of Nations > Health > Question de l'habitation urbaine en France > (169) |
|---|
| Permanent URL | https://digital.nls.uk/191242281 |
|---|
| Description | Par Étienne Dennery. |
|---|---|
| Shelfmark | LN.III.1.(9) |
| Attribution and copyright: |
|
| Shelfmark | LN.III |
|---|---|
| Description | Over 1,200 documents from the non-political organs of the League of Nations that dealt with health, disarmament, economic and financial matters for the duration of the League (1919-1945). Also online are statistical bulletins, essential facts, and an overview of the League by the first Secretary General, Sir Eric Drummond. These items are part of the Official Publications collection at the National Library of Scotland. |
|---|---|
| Additional NLS resources: |
|