Economic and financial section > Interim report of the Gold Delegation of the Financial Committee
(92)
Download files
Complete book:
Individual page:
Thumbnail gallery: Grid view | List view
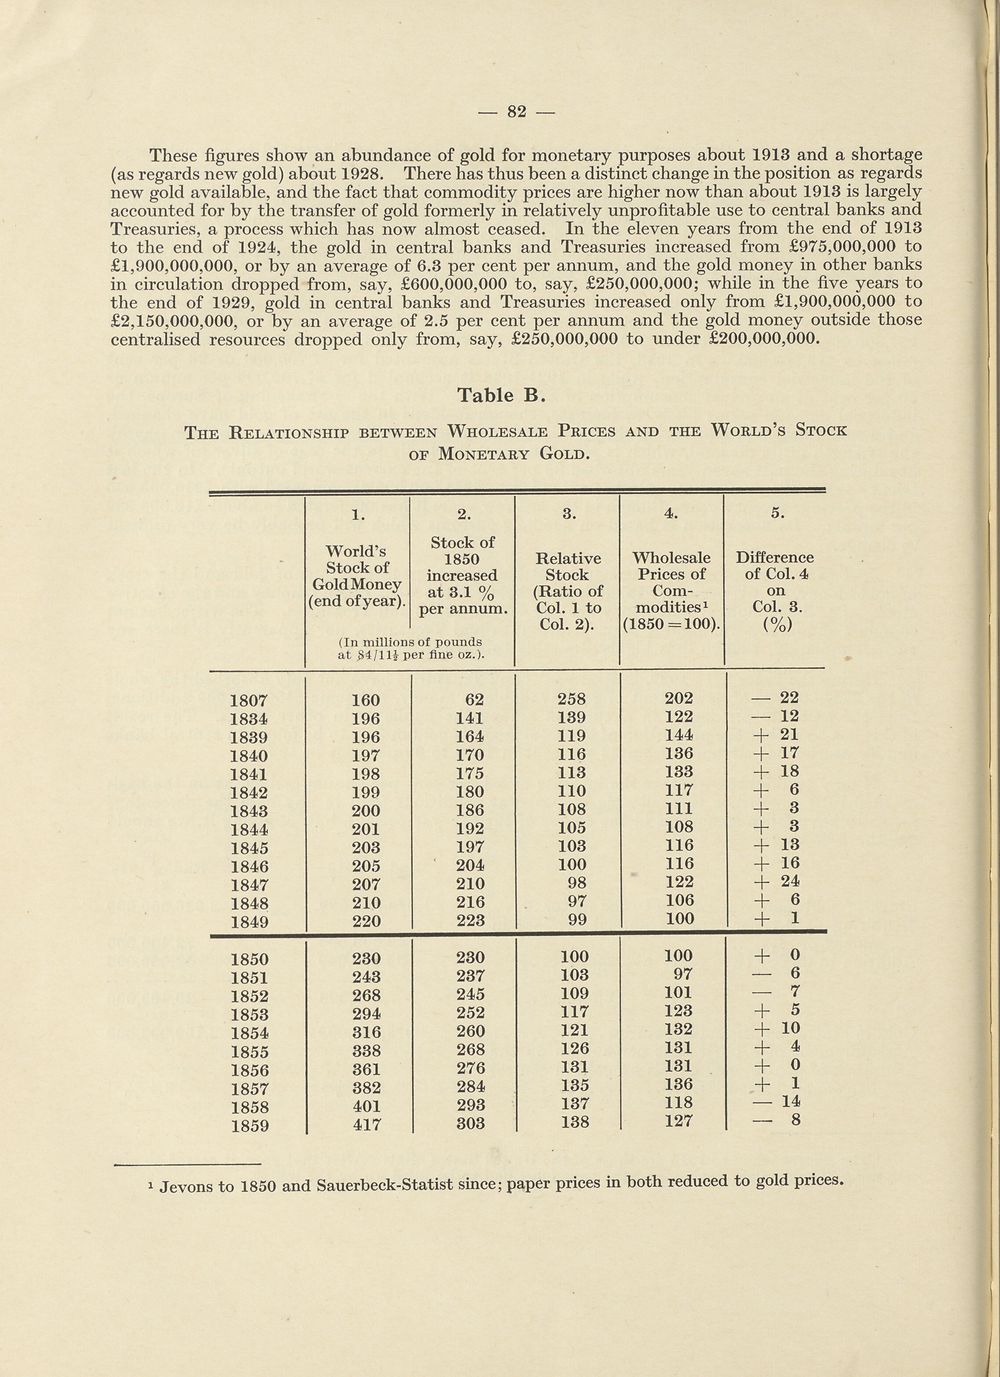
These figures show an abundance of gold for monetary purposes about 1913 and a shortage
(as regards new gold) about 1928. There has thus been a distinct change in the position as regards
new gold available, and the fact that commodity prices are higher now than about 1913 is largely
accounted for by the transfer of gold formerly in relatively unprofitable use to central banks and
Treasuries, a process which has now almost ceased. In the eleven years from the end of 1913
to the end of 1924, the gold in central banks and Treasuries increased from £975,000,000 to
£1,900,000,000, or by an average of 6.3 per cent per annum, and the gold money in other banks
in circulation dropped from, say, £600,000,000 to, say, £250,000,000; while in the five years to
the end of 1929, gold in central banks and Treasuries increased only from £1,900,000,000 to
£2,150,000,000, or by an average of 2.5 per cent per annum and the gold money outside those
centralised resources dropped only from, say, £250,000,000 to under £200,000,000.
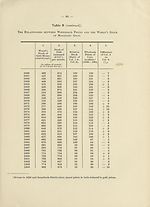
Table B.
The Relationship between Wholesale Prices and the World’s Stock
of Monetary Gold.
World’s
Stock of
Gold Money
(end ofyear).
2.
Stock of
1850
increased
at 3.1 %
per annum.
(In millions of pounds
at S4/1H per fine oz.).
3.
Relative
Stock
(Ratio of
Col. 1 to
Col. 2).
4.
Wholesale
Prices of
Com¬
modities1
(1850 = 100).
5.
Difference
of Col. 4
on
Col. 3.
(%)
1807
1834
1839
1840
1841
1842
1843
1844
1845
1846
1847
1848
1849
160
196
196
197
198
199
200
201
203
205
207
210
220
62
141
164
170
175
180
186
192
197
204
210
216
223
258
139
119
116
113
110
108
105
103
100
98
97
99
202
122
144
136
133
117
111
108
116
116
122
106
100
— 22
— 12
+ 21
+ 17
+ 18
+ 6
+ 3
+ 3
+ 13
+ 16
+ 24
+
+
1850
1851
1852
1853
1854
1855
1856
1857
1858
1859
230
243
268
294
316
338
361
382
401
417
230
237
245
252
260
268
276
284
293
303
100
103
109
117
121
126
131
135
137
138
100
97
101
123
132
131
131
136
118
127
+ 0
— 6
— 7
+ 5
+ 10
+ 4
+ 0
+ 1
— 14
— 8
1 Jevons to 1850 and Sauerbeck-Statist since; paper prices in both reduced to gold prices.
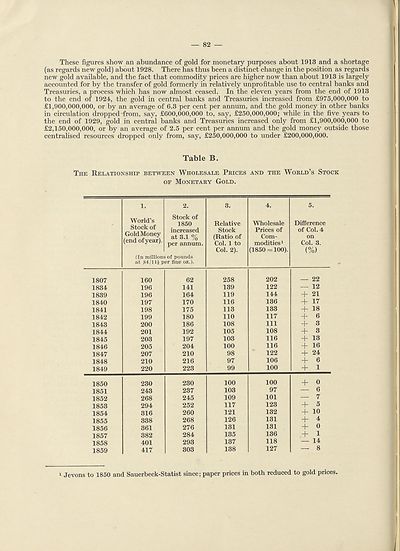
(as regards new gold) about 1928. There has thus been a distinct change in the position as regards
new gold available, and the fact that commodity prices are higher now than about 1913 is largely
accounted for by the transfer of gold formerly in relatively unprofitable use to central banks and
Treasuries, a process which has now almost ceased. In the eleven years from the end of 1913
to the end of 1924, the gold in central banks and Treasuries increased from £975,000,000 to
£1,900,000,000, or by an average of 6.3 per cent per annum, and the gold money in other banks
in circulation dropped from, say, £600,000,000 to, say, £250,000,000; while in the five years to
the end of 1929, gold in central banks and Treasuries increased only from £1,900,000,000 to
£2,150,000,000, or by an average of 2.5 per cent per annum and the gold money outside those
centralised resources dropped only from, say, £250,000,000 to under £200,000,000.
Table B.
The Relationship between Wholesale Prices and the World’s Stock
of Monetary Gold.
World’s
Stock of
Gold Money
(end ofyear).
2.
Stock of
1850
increased
at 3.1 %
per annum.
(In millions of pounds
at S4/1H per fine oz.).
3.
Relative
Stock
(Ratio of
Col. 1 to
Col. 2).
4.
Wholesale
Prices of
Com¬
modities1
(1850 = 100).
5.
Difference
of Col. 4
on
Col. 3.
(%)
1807
1834
1839
1840
1841
1842
1843
1844
1845
1846
1847
1848
1849
160
196
196
197
198
199
200
201
203
205
207
210
220
62
141
164
170
175
180
186
192
197
204
210
216
223
258
139
119
116
113
110
108
105
103
100
98
97
99
202
122
144
136
133
117
111
108
116
116
122
106
100
— 22
— 12
+ 21
+ 17
+ 18
+ 6
+ 3
+ 3
+ 13
+ 16
+ 24
+
+
1850
1851
1852
1853
1854
1855
1856
1857
1858
1859
230
243
268
294
316
338
361
382
401
417
230
237
245
252
260
268
276
284
293
303
100
103
109
117
121
126
131
135
137
138
100
97
101
123
132
131
131
136
118
127
+ 0
— 6
— 7
+ 5
+ 10
+ 4
+ 0
+ 1
— 14
— 8
1 Jevons to 1850 and Sauerbeck-Statist since; paper prices in both reduced to gold prices.
Set display mode to:
![]() Universal Viewer |
Universal Viewer | ![]() Mirador |
Large image | Transcription
Mirador |
Large image | Transcription
Images and transcriptions on this page, including medium image downloads, may be used under the Creative Commons Attribution 4.0 International Licence unless otherwise stated. ![]()
| League of Nations > Economic and financial section > Interim report of the Gold Delegation of the Financial Committee > (92) |
|---|
| Permanent URL | https://digital.nls.uk/190954341 |
|---|
| Shelfmark | LN.II.18.(1) |
|---|---|
| Attribution and copyright: |
|
| Shelfmark | LN.II |
|---|
| Description | Over 1,200 documents from the non-political organs of the League of Nations that dealt with health, disarmament, economic and financial matters for the duration of the League (1919-1945). Also online are statistical bulletins, essential facts, and an overview of the League by the first Secretary General, Sir Eric Drummond. These items are part of the Official Publications collection at the National Library of Scotland. |
|---|---|
| Additional NLS resources: |
|