Economic and financial section > Interim report of the Gold Delegation of the Financial Committee
(28)


Download files
Complete book:
Individual page:
Thumbnail gallery: Grid view | List view
26 —
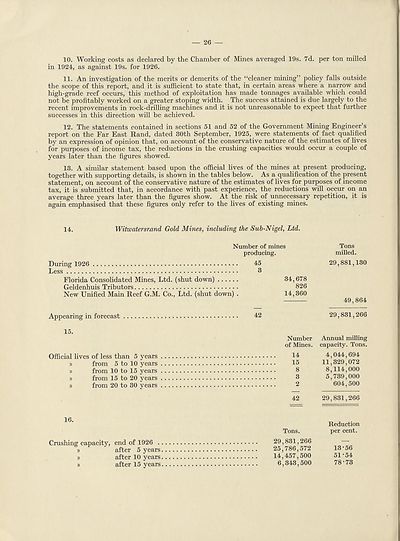
10. Working costs as declared by the Chamber of Mines averaged 19s. 7d. per ton milled
in 1924, as against 19s. for 1926.
11. An investigation of the merits or demerits of the “cleaner mining” policy falls outside
the scope of this report, and it is sufficient to state that, in certain areas where a narrow and
high-grade reef occurs, this method of exploitation has made tonnages available which could
not be profitably worked on a greater stoping width. The success attained is due largely to the
recent improvements in rock-drilling machines and it is not unreasonable to expect that further
successes in this direction will be achieved.
12. The statements contained in sections 51 and 52 of the Government Mining Engineer’s
report on the Far East Rand, dated 30th September, 1925, were statements of fact qualified
by an expression of opinion that, on account of the conservative nature of the estimates of lives
for purposes of income tax, the reductions in the crushing capacities would occur a couple of
years later than the figures showed.
13. A similar statement based upon the official lives of the mines at present producing,
together with supporting details, is shown in the tables below. As a qualification of the present
statement, on account of the conservative nature of the estimates of lives for purposes of income
tax, it is submitted that, in accordance with past experience, the reductions will occur on an
average three years later than the figures show. At the risk of unnecessary repetition, it is
again emphasised that these figures only refer to the lives of existing mines.
14. Witwatersrand Gold Mines, including the Sub-Nigel, Ltd.
Number of mines
producing.
Tons
milled.
During 1926 45
Less 3
Florida Consolidated Mines, Ltd. (shut down)
Geldenhuis Tributers
New Unified Main Reef G.M. Co., Ltd. (shut down) .
29,881,130
34,678
826
14,360
49,864
Appearing in forecast
42
29,831,266
15.
Official lives of less than 5 years
» from 5 to 10 years
» from 10 to 15 years
» from 15 to 20 years
» from 20 to 30 years
16.
Crushing capacity,
»
»
»
end of 1926 .
after 5 years
after 10 years
after 15 years
Number
of Mines.
14
15
8
3
2
42
Tons.
29,831,266
25,786,572
14,457,500
6,343,500
Annual milling
capacity. Tons.
4,044,694
11,329,072
8,114,000
5,739,000
604,500
29,831,266
Reduction
per cent.
13*56
51*54
78*73
Set display mode to:
![]() Universal Viewer |
Universal Viewer | ![]() Mirador |
Large image | Transcription
Mirador |
Large image | Transcription
Images and transcriptions on this page, including medium image downloads, may be used under the Creative Commons Attribution 4.0 International Licence unless otherwise stated. ![]()
| League of Nations > Economic and financial section > Interim report of the Gold Delegation of the Financial Committee > (28) |
|---|
| Permanent URL | https://digital.nls.uk/190953509 |
|---|
| Shelfmark | LN.II.18.(1) |
|---|---|
| Attribution and copyright: |
|
| Shelfmark | LN.II |
|---|
| Description | Over 1,200 documents from the non-political organs of the League of Nations that dealt with health, disarmament, economic and financial matters for the duration of the League (1919-1945). Also online are statistical bulletins, essential facts, and an overview of the League by the first Secretary General, Sir Eric Drummond. These items are part of the Official Publications collection at the National Library of Scotland. |
|---|---|
| Additional NLS resources: |
|