Download files
Complete book:
Individual page:
Thumbnail gallery: Grid view | List view
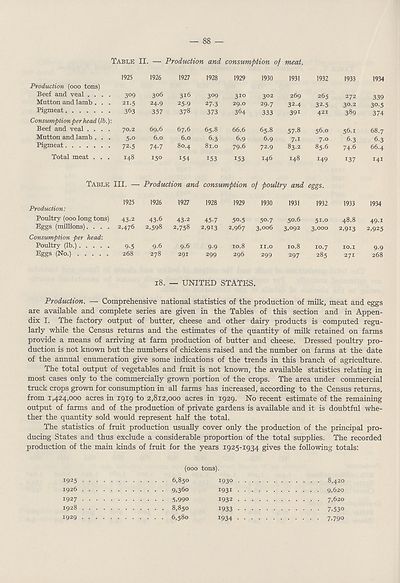
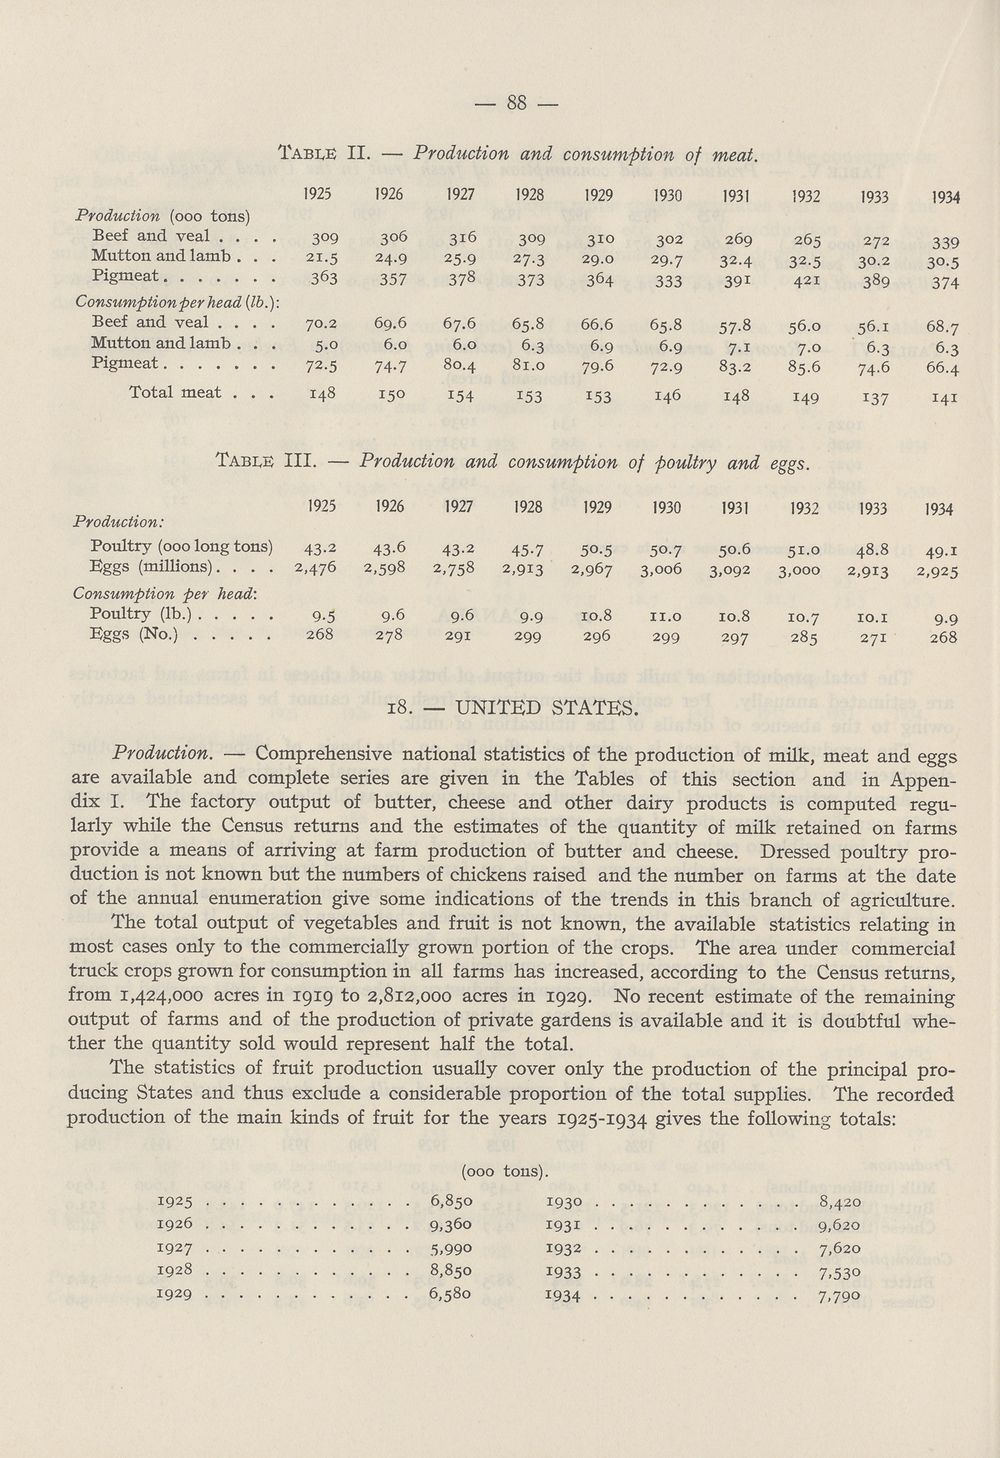
Table II. — Production and consumption of meat.
Production (ooo tons)
Beef and veal ....
Mutton and lamb . . .
Pigmeat
Consumption per head (lb.):
Beef and veal ....
Mutton and lamb . . .
1925
3°9
21-5
363
70.2
5-o
Pigmeat 72.5
Total meat ... 148
1926
306
24.9
357
69.6
6.0
74-7
150
1927
316
25-9
378
67.6
6.0
80.4
154
1928
3°9
27-3
373
65.8
6-3
81.0
153
1929
310
29.0
364
66.6
6.9
79-6
153
1930
302
29.7
333
65.8
6.9
72.9
146
1931
269
32.4
39i
57-8
7-i
83.2
148
1932
265
32.5
421
56.0
7.0
85.6
149
1933
272
30.2
389
56.1
6-3
74.6
137
1934
339
30-5
374
68.7
6-3
66.4
141
Table III. — Production and consumption of poultry and eggs.
Production:
Poultry (000 long tons)
Eggs (millions). . . .
Consumption per head:
Poultry (lb.)
Eggs (No.)
1925
43-2
2,476
9-5
268
1926
43-6
2,598
9.6
278
1927
43-2
2,758
9.6
291
1928
45-7
2,913
9-9
299
1929
50.5
2,967
10.8
296
1930
50-7
3,006
11.o
299
1931
50.6
3,°92
10.8
297
1932
51.0
3,000
10.7
285
1933
48.8
2,913
10.1
271
1934
49.1
2,925
9-9
268
18. _ UNITED STATES.
Production. — Comprehensive national statistics of the production of milk, meat and eggs
are available and complete series are given in the Tables of this section and in Appen¬
dix I. The factory output of butter, cheese and other dairy products is computed regu¬
larly while the Census returns and the estimates of the quantity of milk retained on farms
provide a means of arriving at farm production of butter and cheese. Dressed poultry pro¬
duction is not known but the numbers of chickens raised and the number on farms at the date
of the annual enumeration give some indications of the trends in this branch of agriculture.
The total output of vegetables and fruit is not known, the available statistics relating in
most cases only to the commercially grown portion of the crops. The area under commercial
truck crops grown for consumption in all farms has increased, according to the Census returns,
from 1,424,000 acres in 1919 to 2,812,000 acres in 1929. No recent estimate of the remaining
output of farms and of the production of private gardens is available and it is doubtful whe¬
ther the quantity sold would represent half the total.
The statistics of fruit production usually cover only the production of the principal pro¬
ducing States and thus exclude a considerable proportion of the total supplies. The recorded
production of the main kinds of fruit for the years 1925-1934 gives the following totals:
1925
1926
1927
1928
1929
(000 tons).
6.850 1930 8,420
9,360 1931 9,620
5,990 1932 7,620
8.850 1933 7,530
6,580 1934 7,790
Set display mode to:
![]() Universal Viewer |
Universal Viewer | ![]() Mirador |
Large image | Transcription
Mirador |
Large image | Transcription
Images and transcriptions on this page, including medium image downloads, may be used under the Creative Commons Attribution 4.0 International Licence unless otherwise stated. ![]()
| League of Nations > Economic and financial section > Problem of nutrition > (90) |
|---|
| Permanent URL | https://digital.nls.uk/190928520 |
|---|
| Description | Vol. 4. Statistics of food production, consumption and prices. |
|---|---|
| Shelfmark | LN.II.28.(4) |
| Attribution and copyright: |
|
| Shelfmark | LN.II |
|---|
| Description | Over 1,200 documents from the non-political organs of the League of Nations that dealt with health, disarmament, economic and financial matters for the duration of the League (1919-1945). Also online are statistical bulletins, essential facts, and an overview of the League by the first Secretary General, Sir Eric Drummond. These items are part of the Official Publications collection at the National Library of Scotland. |
|---|---|
| Additional NLS resources: |
|