Download files
Complete book:
Individual page:
Thumbnail gallery: Grid view | List view
85 —
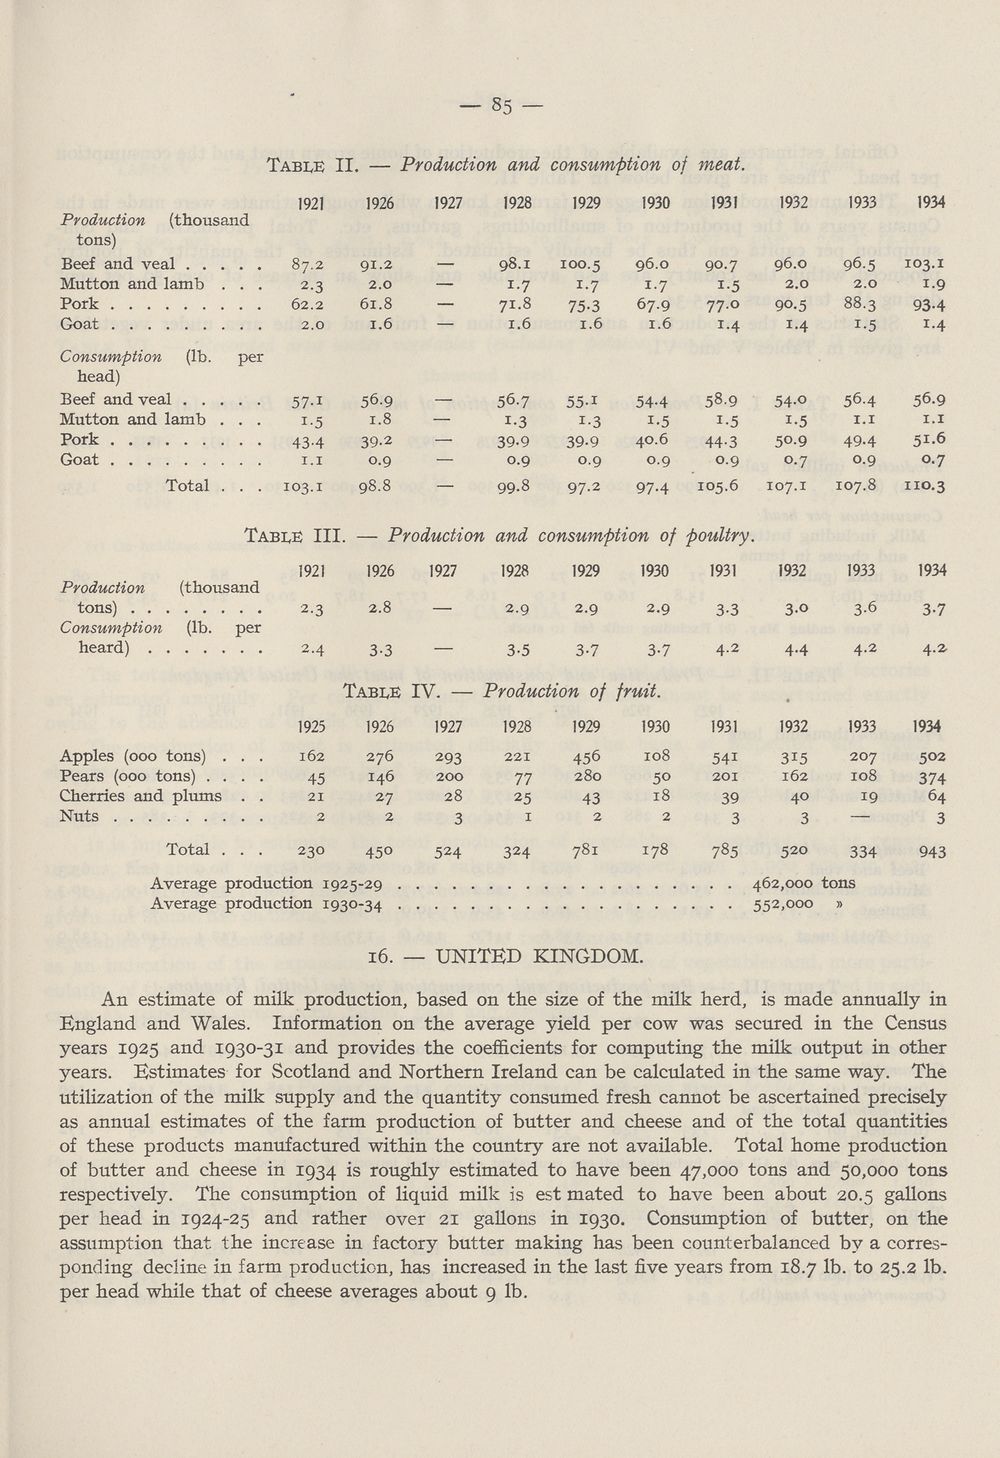
TabIvE II. — Production and consumption of meat.
Production (thousand
tons)
Beef and veal
Mutton and lamb . . .
Pork
Goat
(lb. per
1921
87.2
2.3
62.2
2.0
Consumption
head)
Beef and veal 57.1
Mutton and lamb ... 1.5
Pork 43.4
Goat 1.1
Total ... 103.1
1926
91.2
2.0
61.8
1.6
56.9
1.8
39-2
0.9
98.8
1927
1928
98.1
i-7
71.8
1.6
56.7
i-3
39-9
0.9
99-8
1929
100.5
i-7
75-3
1.6
55-1
i-3
39-9
0.9
97-2
1930
96.0
i-7
67.9
1.6
54-4
1-5
40.6
0.9
97-4
1931
90.7
i-5
77.0
i-4
58.9
i-5
44-3
0.9
105.6
1932
96.0
2.0
90.5
1.4
54-°
1.5
5°-9
0.7
107.1
1933
96.5
2.0
88.3
i-5
56-4
1.1
49-4
0.9
107.8
1934
103.1
i.9
93-4
1.4
56.9
1.1
51.6
0.7
110.3
Tabee III. — Production and consumption of poultry.
Production (thousand
tons)
Consumption (lb. per
heard)
1921
2.3
2.4
1926
2.8
1927
3-3 —
1928
2.9
3-5
1929
2- 9
3- 7
1930
2.9
3-7
1931
3- 3
4- 2
1932
30
4.4
1933
3-6
4.2
1934
3- 7
4- 2'
Tabee IV. — Production of fruit.
Apples (000 tons) .
Pears (000 tons) . .
Cherries and plums
Nuts
Total
1923
162
45
21
2
230
1926
276
146
27
2
450
1927
293
200
28
3
524
1928
221
77
25
1
324
1929
456
280
43
2
1930
108
50
18
781 178
1931
54i
201
39
3
785
1932
3i5
162
40
3
520
1933
207
108
19
334
Average production 1925-29 462,000 tons
Average production 1930-34 552,000 »
1934
502
374
64
3
943
16. — UNITED KINGDOM.
An estimate of milk production, based on the size of the milk herd, is made annually in
England and Wales. Information on the average yield per cow was secured in the Census
years 1925 and 1930-31 and provides the coefficients for computing the milk output in other
years. Estimates for Scotland and Northern Ireland can be calculated in the same way. The
utilization of the milk supply and the quantity consumed fresh cannot be ascertained precisely
as annual estimates of the farm production of butter and cheese and of the total quantities
of these products manufactured within the country are not available. Total home production
of butter and cheese in 1934 is roughly estimated to have been 47,000 tons and 50,000 tons
respectively. The consumption of liquid milk is est mated to have been about 20.5 gallons
per head in 1924-25 and rather over 21 gallons in 1930. Consumption of butter, on the
assumption that the increase in factory butter making has been counterbalanced by a corres¬
ponding decline in farm production, has increased in the last five years from 18.7 lb. to 25.2 lb.
per head while that of cheese averages about 9 lb.
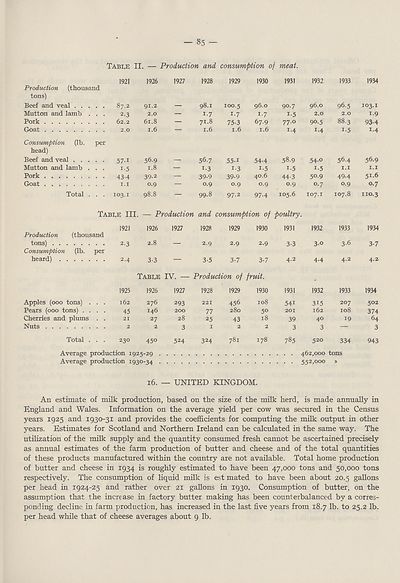
Set display mode to:
![]() Universal Viewer |
Universal Viewer | ![]() Mirador |
Large image | Transcription
Mirador |
Large image | Transcription
Images and transcriptions on this page, including medium image downloads, may be used under the Creative Commons Attribution 4.0 International Licence unless otherwise stated. ![]()
| League of Nations > Economic and financial section > Problem of nutrition > (87) |
|---|
| Permanent URL | https://digital.nls.uk/190928481 |
|---|
| Description | Vol. 4. Statistics of food production, consumption and prices. |
|---|---|
| Shelfmark | LN.II.28.(4) |
| Attribution and copyright: |
|
| Shelfmark | LN.II |
|---|
| Description | Over 1,200 documents from the non-political organs of the League of Nations that dealt with health, disarmament, economic and financial matters for the duration of the League (1919-1945). Also online are statistical bulletins, essential facts, and an overview of the League by the first Secretary General, Sir Eric Drummond. These items are part of the Official Publications collection at the National Library of Scotland. |
|---|---|
| Additional NLS resources: |
|