Download files
Complete book:
Individual page:
Thumbnail gallery: Grid view | List view
— 75
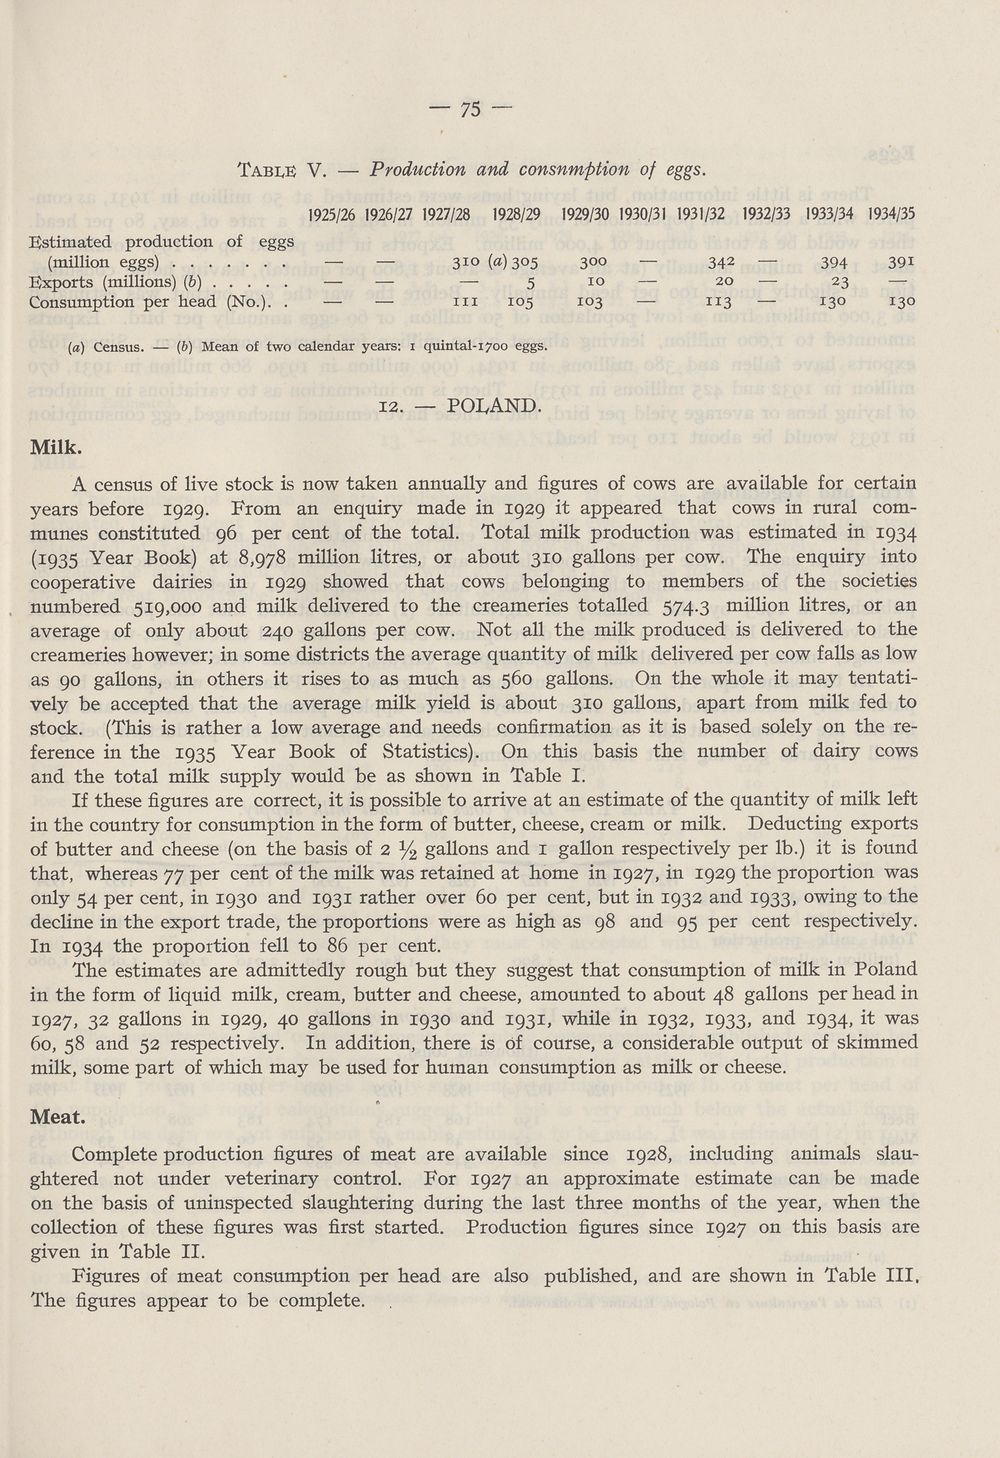
Tabi^e V. — Production and consnmption of eggs.
1925/26 1926/27 1927/28 1928/29 1929/30 1930/31 1931/32 1932/33 1933/34 1934/35
Estimated production of eggs
(million eggs)
Exports (millions) (6)
Consumption per head (No.). .
310 (a) 305
— 5
in 105
300 —
10 —
103 —
342 —
20 —
113 —
394 39i
23
130 130
(a) Census. — (b) Mean of two calendar years: 1 quintal-1700 eggs.
12. — POLAND.
Milk.
A census of live stock is now taken annually and figures of cows are available for certain
years before 1929. From an enquiry made in 1929 it appeared that cows in rural com¬
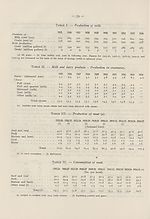
munes constituted 96 per cent of the total. Total milk production was estimated in 1934
(1935 Year Book) at 8,978 million litres, or about 310 gallons per cow. The enquiry into
cooperative dairies in 1929 showed that cows belonging to members of the societies
numbered 519,000 and milk delivered to the creameries totalled 574.3 million litres, or an
average of only about 240 gallons per cow. Not all the milk produced is delivered to the
creameries however; in some districts the average quantity of milk delivered per cow falls as low
as 90 gallons, in others it rises to as much as 560 gallons. On the whole it may tentati¬
vely be accepted that the average milk yield is about 310 gallons, apart from milk fed to
stock. (This is rather a low average and needs confirmation as it is based solely on the re¬
ference in the 1935 Year Book of Statistics). On this basis the number of dairy cows
and the total milk supply would be as shown in Table I.
If these figures are correct, it is possible to arrive at an estimate of the quantity of milk left
in the country for consumption in the form of butter, cheese, cream or milk. Deducting exports
of butter and cheese (on the basis of 2 % gallons and 1 gallon respectively per lb.) it is found
that, whereas 77 per cent of the milk was retained at home in 1927, in 1929 the proportion was
only 54 per cent, in 1930 and 1931 rather over 60 per cent, but in 1932 and 1933, owing to the
decline in the export trade, the proportions were as high as 98 and 95 per cent respectively.
In 1934 the proportion fell to 86 per cent.
The estimates are admittedly rough but they suggest that consumption of milk in Poland
in the form of liquid milk, cream, butter and cheese, amounted to about 48 gallons per head in
1927, 32 gallons in 1929, 40 gallons in 1930 and 1931, while in 1932, 1933, and 1934, it was
60, 58 and 52 respectively. In addition, there is of course, a considerable output of skimmed
milk, some part of which may be used for human consumption as milk or cheese.
Meat.
Complete production figures of meat are available since 1928, including animals slau¬
ghtered not under veterinary control. For 1927 an approximate estimate can be made
on the basis of uninspected slaughtering during the last three months of the year, when the
collection of these figures was first started. Production figures since 1927 on this basis are
given in Table II.
Figures of meat consumption per head are also published, and are shown in Table III,
The figures appear to be complete.
Tabi^e V. — Production and consnmption of eggs.
1925/26 1926/27 1927/28 1928/29 1929/30 1930/31 1931/32 1932/33 1933/34 1934/35
Estimated production of eggs
(million eggs)
Exports (millions) (6)
Consumption per head (No.). .
310 (a) 305
— 5
in 105
300 —
10 —
103 —
342 —
20 —
113 —
394 39i
23
130 130
(a) Census. — (b) Mean of two calendar years: 1 quintal-1700 eggs.
12. — POLAND.
Milk.
A census of live stock is now taken annually and figures of cows are available for certain
years before 1929. From an enquiry made in 1929 it appeared that cows in rural com¬
munes constituted 96 per cent of the total. Total milk production was estimated in 1934
(1935 Year Book) at 8,978 million litres, or about 310 gallons per cow. The enquiry into
cooperative dairies in 1929 showed that cows belonging to members of the societies
numbered 519,000 and milk delivered to the creameries totalled 574.3 million litres, or an
average of only about 240 gallons per cow. Not all the milk produced is delivered to the
creameries however; in some districts the average quantity of milk delivered per cow falls as low
as 90 gallons, in others it rises to as much as 560 gallons. On the whole it may tentati¬
vely be accepted that the average milk yield is about 310 gallons, apart from milk fed to
stock. (This is rather a low average and needs confirmation as it is based solely on the re¬
ference in the 1935 Year Book of Statistics). On this basis the number of dairy cows
and the total milk supply would be as shown in Table I.
If these figures are correct, it is possible to arrive at an estimate of the quantity of milk left
in the country for consumption in the form of butter, cheese, cream or milk. Deducting exports
of butter and cheese (on the basis of 2 % gallons and 1 gallon respectively per lb.) it is found
that, whereas 77 per cent of the milk was retained at home in 1927, in 1929 the proportion was
only 54 per cent, in 1930 and 1931 rather over 60 per cent, but in 1932 and 1933, owing to the
decline in the export trade, the proportions were as high as 98 and 95 per cent respectively.
In 1934 the proportion fell to 86 per cent.
The estimates are admittedly rough but they suggest that consumption of milk in Poland
in the form of liquid milk, cream, butter and cheese, amounted to about 48 gallons per head in
1927, 32 gallons in 1929, 40 gallons in 1930 and 1931, while in 1932, 1933, and 1934, it was
60, 58 and 52 respectively. In addition, there is of course, a considerable output of skimmed
milk, some part of which may be used for human consumption as milk or cheese.
Meat.
Complete production figures of meat are available since 1928, including animals slau¬
ghtered not under veterinary control. For 1927 an approximate estimate can be made
on the basis of uninspected slaughtering during the last three months of the year, when the
collection of these figures was first started. Production figures since 1927 on this basis are
given in Table II.
Figures of meat consumption per head are also published, and are shown in Table III,
The figures appear to be complete.
Set display mode to:
![]() Universal Viewer |
Universal Viewer | ![]() Mirador |
Large image | Transcription
Mirador |
Large image | Transcription
Images and transcriptions on this page, including medium image downloads, may be used under the Creative Commons Attribution 4.0 International Licence unless otherwise stated. ![]()
| League of Nations > Economic and financial section > Problem of nutrition > (77) |
|---|
| Permanent URL | https://digital.nls.uk/190928351 |
|---|
| Description | Vol. 4. Statistics of food production, consumption and prices. |
|---|---|
| Shelfmark | LN.II.28.(4) |
| Attribution and copyright: |
|
| Shelfmark | LN.II |
|---|
| Description | Over 1,200 documents from the non-political organs of the League of Nations that dealt with health, disarmament, economic and financial matters for the duration of the League (1919-1945). Also online are statistical bulletins, essential facts, and an overview of the League by the first Secretary General, Sir Eric Drummond. These items are part of the Official Publications collection at the National Library of Scotland. |
|---|---|
| Additional NLS resources: |
|