Download files
Complete book:
Individual page:
Thumbnail gallery: Grid view | List view
71 —
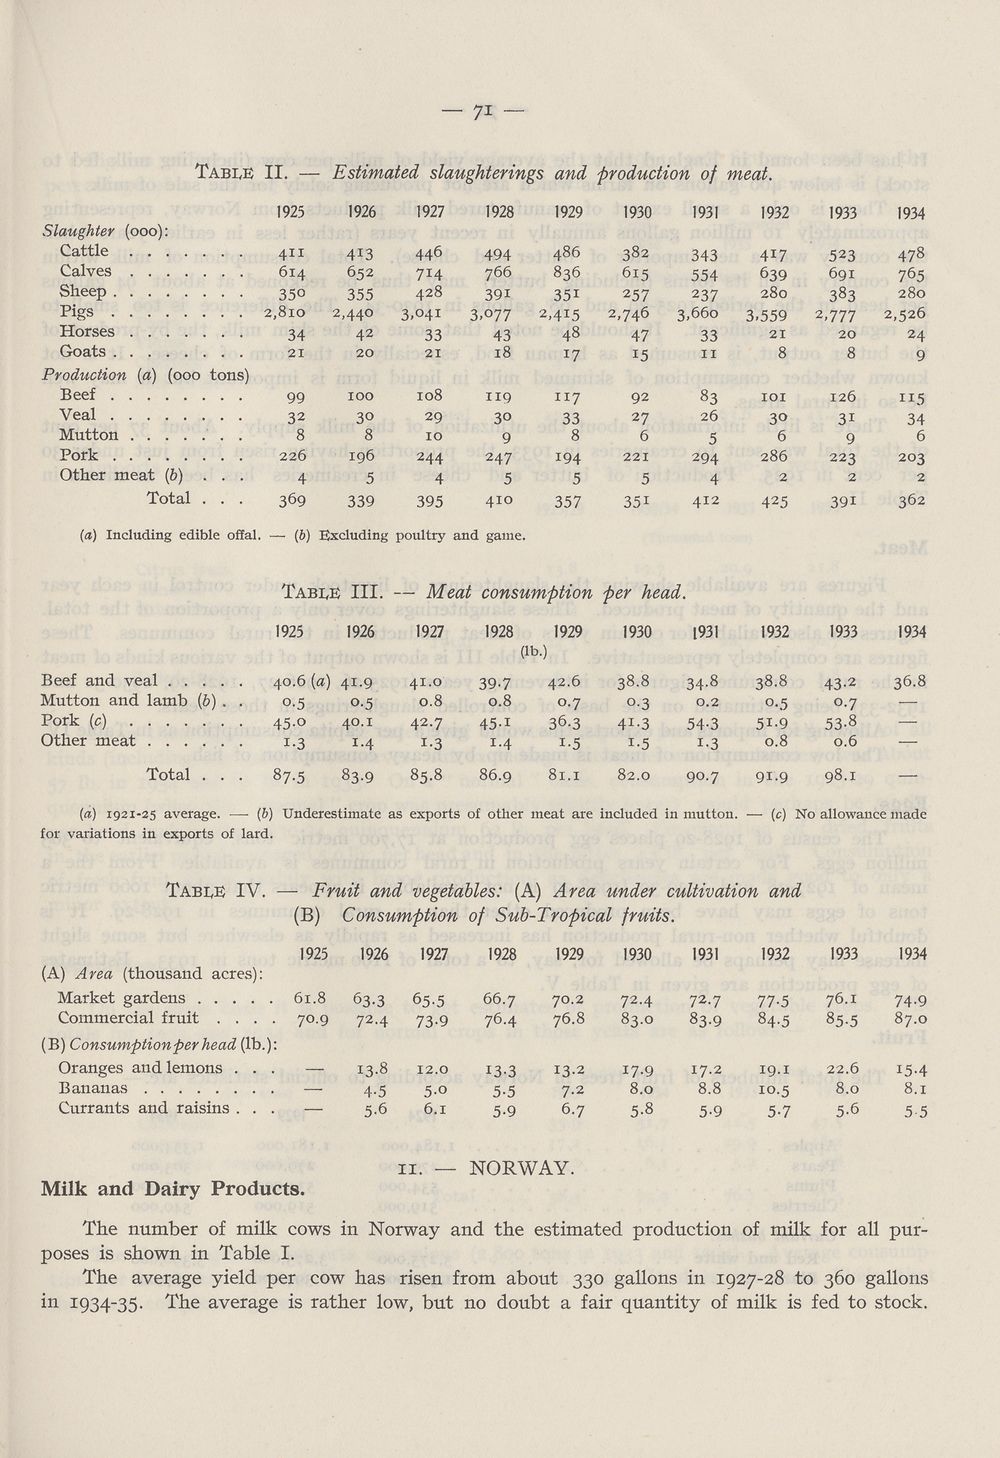
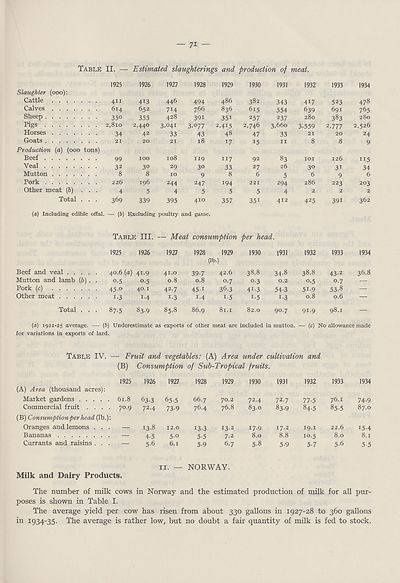
Tab^e II. — Estimated slaughterings and production of meat.
1926 1927 1928 1929 1930 1931 1932
Slaughter (ooo):
Cattle . . .
Calves . . .
Sheep ....
Pigs ....
Horses . . .
Goats ....
Production {a) (ooo tons)
Beef
Veal
Mutton
Pork
Other meat (6) ...
Total . . .
1925
411
614
350
2,810
34
21
99
32
8
226
4
369
413
652
355
2,440
42
20
100
30
8
196
5
339
446
714
428
3,041
33
21
108
29
10
244
4
395
494
766
39i
3,077
43
18
119
30
9
247
5
410
836
35i
2,415
48
17
117
33
8
194
5
357
382
615
257
2,746
47
15
92
27
6
221
5
35i
343
554
237
3,660
33
11
83
26
5
294
4
412
417
639
280
3.559
21
8
101
30
6
286
2
425
1933
523
691
383
2,777
20
8
126
3i
9
223
2
39i
1934
478
765
280
2,526
24
9
115
34
6
203
2
362
(a) Including edible offal. — {b) Excluding poultry and game.
Beef and veal . .
Mutton and lamb
Pork (c) ....
Other meat . . .
(6).
Total
Tabee III.
1925 1926
40.6 {a) 41.9
0.5 0.5
45.0 40.1
1.3 1.4
— Meat consumption per head.
1927
41.0
0.8
42.7
i-3
1928
39-7
0.8
45-i
1.4
(lb.)
1929
42.6
0.7
36.3
i-5
87.5 83.9 85.8 86.9 81.1
1930
38.8
°-3
4I-3
i-5
82.0
1931
34-8
0.2
54-3
i-3
90.7
1932
38.8
0.5
51-9
0.8
91.9
1933
43-2
0.7
53-8
0.6
1934
36.8
98.1 —
[a) 1921-25 average. — (6) Underestimate as exports of other meat are included in mutton. — (c) No allowance made
for variations in exports of lard.
Tabee IV. — Fruit and vegetables: (A) Area under cultivation and
(B) Consumption of Sub-Tropical fruits.
1925 1926
(A) Area (thousand acres):
Market gardens 61.8 63.3
Commercial fruit .... 70.9 72.4
(B) Consumption per head (lb.):
Oranges and lemons ... — 13.8
Bananas — 4.5
Currants and raisins ... — 5.6
1927
65-5
73-9
5-o
6.1
1928
66.7
76.4
13-3
5-5
5-9
1929
70.2
76.8
13.2
7.2
6.7
1930
72.4
83.0
17.9
8.0
5-8
1931
72.7
83-9
17.2
8.8
5-9
1932
77-5
84-5
19.1
10.5
5-7
1933
76.1
85-5
22.6
8.0
5-6
1934
74-9
87.0
15-4
8.1
5 5
Milk and Dairy Products.
11.
NORWAY.
The number of milk cows in Norway and the estimated production of milk for all pur¬
poses is shown in Table I.
The average yield per cow has risen from about 330 gallons in 1927-28 to 360 gallons
in 1934-35. The average is rather low, but no doubt a fair quantity of milk is fed to stock.
Set display mode to:
![]() Universal Viewer |
Universal Viewer | ![]() Mirador |
Large image | Transcription
Mirador |
Large image | Transcription
Images and transcriptions on this page, including medium image downloads, may be used under the Creative Commons Attribution 4.0 International Licence unless otherwise stated. ![]()
| League of Nations > Economic and financial section > Problem of nutrition > (73) |
|---|
| Permanent URL | https://digital.nls.uk/190928299 |
|---|
| Description | Vol. 4. Statistics of food production, consumption and prices. |
|---|---|
| Shelfmark | LN.II.28.(4) |
| Attribution and copyright: |
|
| Shelfmark | LN.II |
|---|
| Description | Over 1,200 documents from the non-political organs of the League of Nations that dealt with health, disarmament, economic and financial matters for the duration of the League (1919-1945). Also online are statistical bulletins, essential facts, and an overview of the League by the first Secretary General, Sir Eric Drummond. These items are part of the Official Publications collection at the National Library of Scotland. |
|---|---|
| Additional NLS resources: |
|