Download files
Complete book:
Individual page:
Thumbnail gallery: Grid view | List view
67 —
Milk:
Number of dairy
cows {a) (thousands)
Milk production (mil¬
lion gallons) . . .
Butter (ooo tons) . . .
Cheese (ooo tons) . . .
Meat (ooo tons):
Beef and veal . . .
Mutton and lamb . .
Pork
Eggs:
Number of laying
hens (millions) . .
Production of eggs
(millions)
Poultry (ooo tons). . .
Fruit (ooo tons) . . .
Vegetables
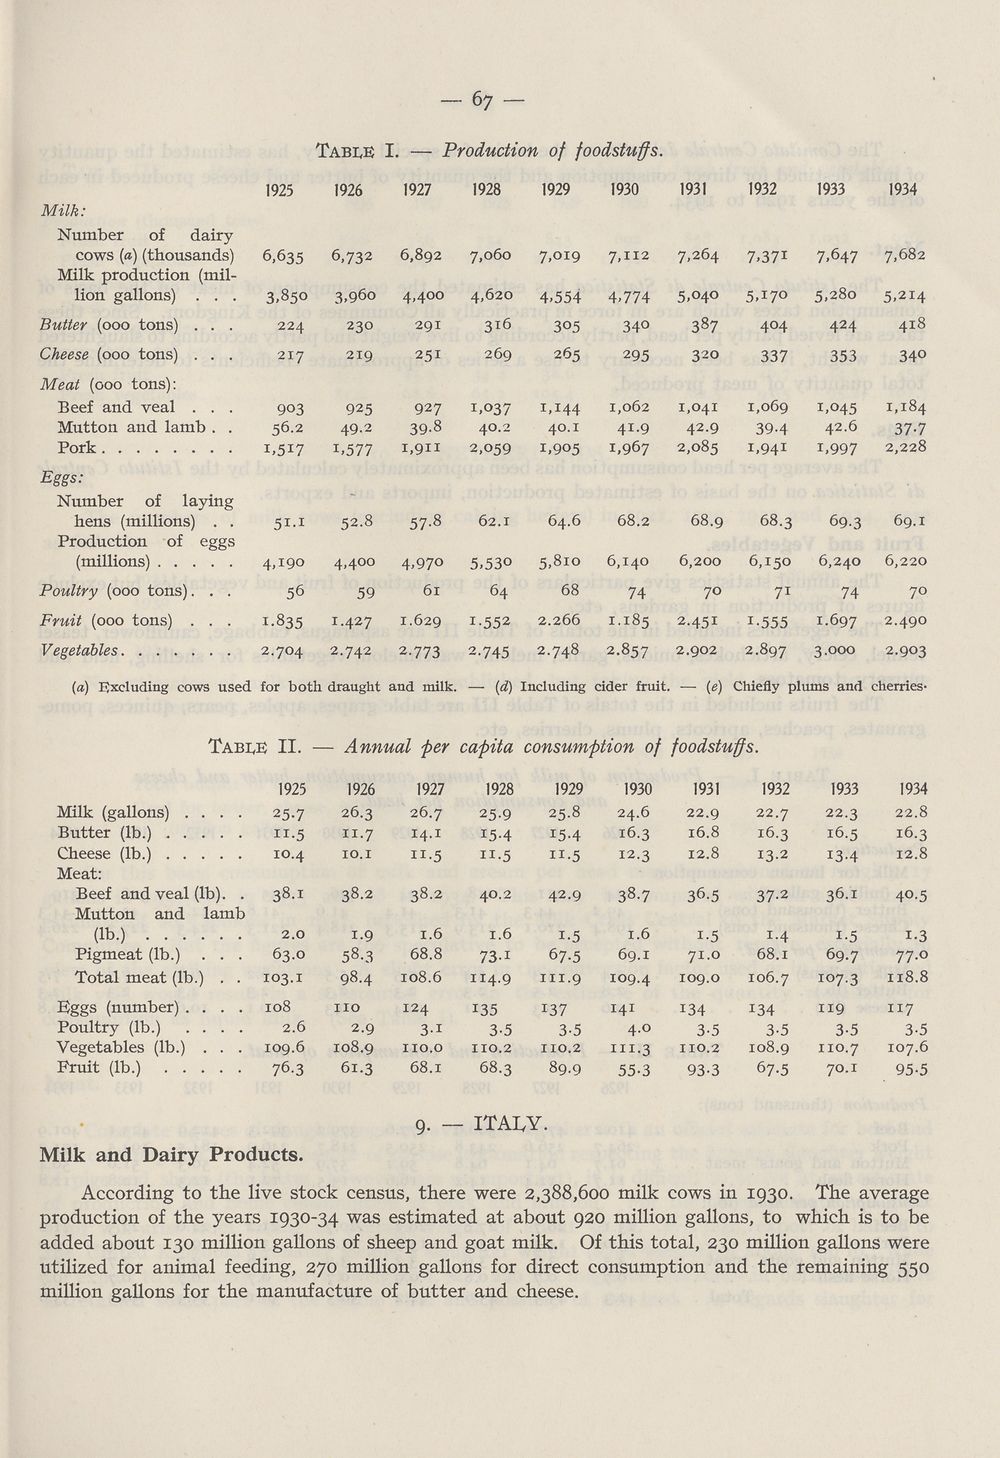
Tabi^E I. — Production of foodstuffs.
1925 1926 1927 1928 1929 1930 1931
224
217
903
56.2
i>5i7
51-1
1932
1933
3,850 3,96o 4,400 4,620 4,554 4,774
230
219
925
49-2
i,577
291
251
927
39-8
1,911:
316
269
1,037
40.2
2,059
305
265
1,144
40.1
1,905
34°
295
1,062
4I-9
5,040
387
320
1,041
42.9
1,967 2,085
337
1,069
39-4
I.941
1,045
42.6
i,997
52.8 57.8 62.1 64.6 68.2
68.9
6,200
1934
6,635 6,732 6,892 7,060 7,019 7,112 7,264 7,371 7,647 7,682
5,170 5,280 5,214
404 424 418
353
34°
1,184
37-7
2,228
68.3 69.3 69.1
4,190 4,400 4,970 5,530 5,810 6,140 6,200 6,150 6,240 6,220
56 59 61 64 68 74 70 71 74 70
1.835 M27 i-629 1.552 2.266 1.185 2.451 1.555 1-697 2.490
2.704 2.742 2.773 2.745 2.748 2.857 2.902 2.897 3.000 2.903
(a) Excluding cows used for both draught and milk. — {d) Including cider fruit. — (e) Chiefly plums and cherries-
Tabi^E II. — Annual per capita consumption of foodstuffs.
Kggs (number) .
Poultry (lb.)
Vegetables (lb.)
Fruit (lb.) . .
1925
25-7
n-5
Milk (gallons) . . .
Butter (lb.) ....
Cheese (lb.) 10.4
Meat:
Beef and veal (lb). .
Mutton and lamb
(lb.) 2.0
Pigmeat (lb.) . . . 63.0
Total meat (lb.) . . 103.1
108
2.6
109.6
76.3
1926
26.3
II-7
10.1
1.9
58.3
98.4
no
2.9
108.9
1927
26.7
14.x
H-5
38.1 38.2 38.2
1.6
68.8
108.6
124
3-i
110.0
1928
25-9
15-4
H-5
40.2
1.6
73-i
ii4-9
135
3-5
no.2
1929
25.8
15-4
II-5
42.9
i-5
67-5
in.9
137
3-5
no.2
1930
24.6
16.3
12.3
1.6
69.1
109.4
141
4.0
in.3
1931
22.9
16.8
12.8
38.7 36.5
i-5
71.0
109.0
134
3-5
110.2
1932
22.7
16.3
13.2
37-2
1.4
68.1
106.7
134
3-5
108.9
61.3 68.1 68.3 89.9 55.3 93.3 67.5
1933
22.3
16.5
i3-4
36.1
i-5
69.7
io7-3
119
3-5
110.7
70.1
1934
22.8
16.3
12.8
40.5
1-3
77.0
118.8
117
3-5
107.6
95-5
Milk and Dairy Products.
ITALY.
According to the live stock census, there were 2,388,600 milk cows in 1930. The average
production of the years 1930-34 was estimated at about 920 million gallons, to which is to be
added about 130 million gallons of sheep and goat milk. Of this total, 230 million gallons were
utilized for animal feeding, 270 million gallons for direct consumption and the remaining 550
million gallons for the manufacture of butter and cheese.
Milk:
Number of dairy
cows {a) (thousands)
Milk production (mil¬
lion gallons) . . .
Butter (ooo tons) . . .
Cheese (ooo tons) . . .
Meat (ooo tons):
Beef and veal . . .
Mutton and lamb . .
Pork
Eggs:
Number of laying
hens (millions) . .
Production of eggs
(millions)
Poultry (ooo tons). . .
Fruit (ooo tons) . . .
Vegetables
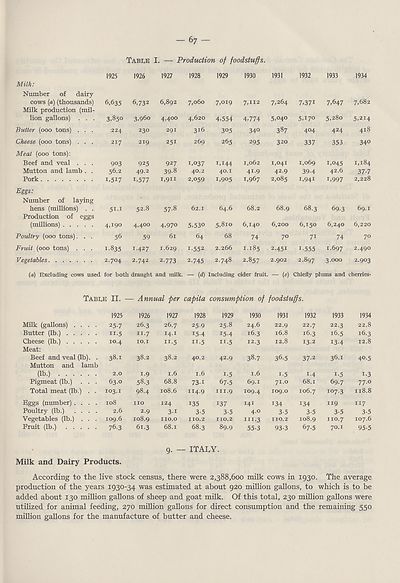
Tabi^E I. — Production of foodstuffs.
1925 1926 1927 1928 1929 1930 1931
224
217
903
56.2
i>5i7
51-1
1932
1933
3,850 3,96o 4,400 4,620 4,554 4,774
230
219
925
49-2
i,577
291
251
927
39-8
1,911:
316
269
1,037
40.2
2,059
305
265
1,144
40.1
1,905
34°
295
1,062
4I-9
5,040
387
320
1,041
42.9
1,967 2,085
337
1,069
39-4
I.941
1,045
42.6
i,997
52.8 57.8 62.1 64.6 68.2
68.9
6,200
1934
6,635 6,732 6,892 7,060 7,019 7,112 7,264 7,371 7,647 7,682
5,170 5,280 5,214
404 424 418
353
34°
1,184
37-7
2,228
68.3 69.3 69.1
4,190 4,400 4,970 5,530 5,810 6,140 6,200 6,150 6,240 6,220
56 59 61 64 68 74 70 71 74 70
1.835 M27 i-629 1.552 2.266 1.185 2.451 1.555 1-697 2.490
2.704 2.742 2.773 2.745 2.748 2.857 2.902 2.897 3.000 2.903
(a) Excluding cows used for both draught and milk. — {d) Including cider fruit. — (e) Chiefly plums and cherries-
Tabi^E II. — Annual per capita consumption of foodstuffs.
Kggs (number) .
Poultry (lb.)
Vegetables (lb.)
Fruit (lb.) . .
1925
25-7
n-5
Milk (gallons) . . .
Butter (lb.) ....
Cheese (lb.) 10.4
Meat:
Beef and veal (lb). .
Mutton and lamb
(lb.) 2.0
Pigmeat (lb.) . . . 63.0
Total meat (lb.) . . 103.1
108
2.6
109.6
76.3
1926
26.3
II-7
10.1
1.9
58.3
98.4
no
2.9
108.9
1927
26.7
14.x
H-5
38.1 38.2 38.2
1.6
68.8
108.6
124
3-i
110.0
1928
25-9
15-4
H-5
40.2
1.6
73-i
ii4-9
135
3-5
no.2
1929
25.8
15-4
II-5
42.9
i-5
67-5
in.9
137
3-5
no.2
1930
24.6
16.3
12.3
1.6
69.1
109.4
141
4.0
in.3
1931
22.9
16.8
12.8
38.7 36.5
i-5
71.0
109.0
134
3-5
110.2
1932
22.7
16.3
13.2
37-2
1.4
68.1
106.7
134
3-5
108.9
61.3 68.1 68.3 89.9 55.3 93.3 67.5
1933
22.3
16.5
i3-4
36.1
i-5
69.7
io7-3
119
3-5
110.7
70.1
1934
22.8
16.3
12.8
40.5
1-3
77.0
118.8
117
3-5
107.6
95-5
Milk and Dairy Products.
ITALY.
According to the live stock census, there were 2,388,600 milk cows in 1930. The average
production of the years 1930-34 was estimated at about 920 million gallons, to which is to be
added about 130 million gallons of sheep and goat milk. Of this total, 230 million gallons were
utilized for animal feeding, 270 million gallons for direct consumption and the remaining 550
million gallons for the manufacture of butter and cheese.
Set display mode to:
![]() Universal Viewer |
Universal Viewer | ![]() Mirador |
Large image | Transcription
Mirador |
Large image | Transcription
Images and transcriptions on this page, including medium image downloads, may be used under the Creative Commons Attribution 4.0 International Licence unless otherwise stated. ![]()
| League of Nations > Economic and financial section > Problem of nutrition > (69) |
|---|
| Permanent URL | https://digital.nls.uk/190928247 |
|---|
| Description | Vol. 4. Statistics of food production, consumption and prices. |
|---|---|
| Shelfmark | LN.II.28.(4) |
| Attribution and copyright: |
|
| Shelfmark | LN.II |
|---|
| Description | Over 1,200 documents from the non-political organs of the League of Nations that dealt with health, disarmament, economic and financial matters for the duration of the League (1919-1945). Also online are statistical bulletins, essential facts, and an overview of the League by the first Secretary General, Sir Eric Drummond. These items are part of the Official Publications collection at the National Library of Scotland. |
|---|---|
| Additional NLS resources: |
|