Download files
Complete book:
Individual page:
Thumbnail gallery: Grid view | List view
— 63 —
General.
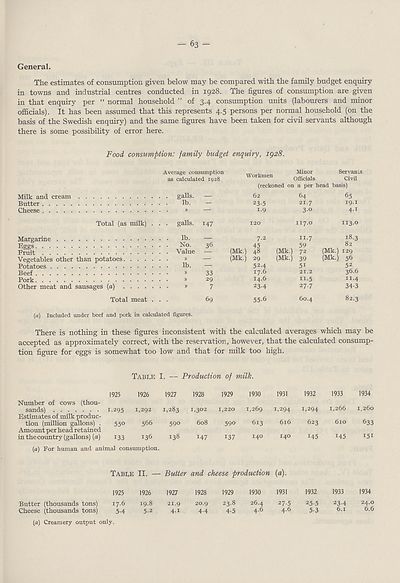
The estimates of consumption given below may be compared with the family budget enquiry
in towns and industrial centres conducted in 1928. The figures of consumption are given
in that enquiry per “ normal household ” of 3.4 consumption units (labourers and minor
officials). It has been assumed that this represents 4.5 persons per normal household (on the
basis of the Swedish enquiry) and the same figures have been taken for civil servants although
there is some possibility of error here.
Food consumption: family budget enquiry, 1928.
Average consumption
as calculated 1928
Workmen
Milk and cream
Butter
Cheese
Total (as milk)
galls. —
lb. -
galls. 147
No.
Value
Margarine Ik-
Eggs
Fruit
Vegetables other than potatoes
Potatoes
Beef
Pork
Other meat and sausages (a)
Total meat
(a) Included under beef and pork in calculated figures.
36
lb. —
» 33
» 29
» 7
69
Minor Servants
Officials Civil
(reckoned on a per head basis)
(Mk.)
(Mk.)
62
23-5
1.9
120
7.2
45
48
29
52.4
17.6
14.6
23-4
55-6
(Mk.)
(Mk.)
64
21.7
3-o
117.0
11.7
59
72
39
5i
21.2
H-5
27.7
60.4
65
19.1
4-1
113.0
18.3
82
(Mk.) 129
(Mk.) 56
52
36.6
11.4
34-3
82.3
There is nothing in these figures inconsistent with the calculated averages which may be
accepted as approximately correct, with the reservation, however, that the calculated consump¬
tion figure for eggs is somewhat too low and that for milk too high.
1925
Number of cows (thou¬
sands) 1-295
Estimates of milk produc¬
tion (million gallons) . 550
Amount per head retained
in the country (gallons) (a) 133
Tabi.E I. — Production of milk.
1926 1927 1928 1929 1930
1,292 1,283 I)302
566 590 608
136 138 147
(a) For human and animal consumption.
1,220
590
137
1,269
613
140
1931
1,294
616
140
1932
1,294
623
i45
1933
1,266
610
i45
1934
1.260
633
151
TabeE II. — Butter and cheese production (a).
Butter (thousands tons)
Cheese (thousands tons)
1925
17.6
5-4
1926
19.8
5-2
1927
21.9
4.1
1928
20.9
4.4
1929
23.8
4-5
1930
26.4
4.6
1931
27-5
4.6
(a) Creamery output only.
1932
25-5
5-3
1933
23-4
6.1
1934
24.0
6.6
General.
The estimates of consumption given below may be compared with the family budget enquiry
in towns and industrial centres conducted in 1928. The figures of consumption are given
in that enquiry per “ normal household ” of 3.4 consumption units (labourers and minor
officials). It has been assumed that this represents 4.5 persons per normal household (on the
basis of the Swedish enquiry) and the same figures have been taken for civil servants although
there is some possibility of error here.
Food consumption: family budget enquiry, 1928.
Average consumption
as calculated 1928
Workmen
Milk and cream
Butter
Cheese
Total (as milk)
galls. —
lb. -
galls. 147
No.
Value
Margarine Ik-
Eggs
Fruit
Vegetables other than potatoes
Potatoes
Beef
Pork
Other meat and sausages (a)
Total meat
(a) Included under beef and pork in calculated figures.
36
lb. —
» 33
» 29
» 7
69
Minor Servants
Officials Civil
(reckoned on a per head basis)
(Mk.)
(Mk.)
62
23-5
1.9
120
7.2
45
48
29
52.4
17.6
14.6
23-4
55-6
(Mk.)
(Mk.)
64
21.7
3-o
117.0
11.7
59
72
39
5i
21.2
H-5
27.7
60.4
65
19.1
4-1
113.0
18.3
82
(Mk.) 129
(Mk.) 56
52
36.6
11.4
34-3
82.3
There is nothing in these figures inconsistent with the calculated averages which may be
accepted as approximately correct, with the reservation, however, that the calculated consump¬
tion figure for eggs is somewhat too low and that for milk too high.
1925
Number of cows (thou¬
sands) 1-295
Estimates of milk produc¬
tion (million gallons) . 550
Amount per head retained
in the country (gallons) (a) 133
Tabi.E I. — Production of milk.
1926 1927 1928 1929 1930
1,292 1,283 I)302
566 590 608
136 138 147
(a) For human and animal consumption.
1,220
590
137
1,269
613
140
1931
1,294
616
140
1932
1,294
623
i45
1933
1,266
610
i45
1934
1.260
633
151
TabeE II. — Butter and cheese production (a).
Butter (thousands tons)
Cheese (thousands tons)
1925
17.6
5-4
1926
19.8
5-2
1927
21.9
4.1
1928
20.9
4.4
1929
23.8
4-5
1930
26.4
4.6
1931
27-5
4.6
(a) Creamery output only.
1932
25-5
5-3
1933
23-4
6.1
1934
24.0
6.6
Set display mode to:
![]() Universal Viewer |
Universal Viewer | ![]() Mirador |
Large image | Transcription
Mirador |
Large image | Transcription
Images and transcriptions on this page, including medium image downloads, may be used under the Creative Commons Attribution 4.0 International Licence unless otherwise stated. ![]()
| League of Nations > Economic and financial section > Problem of nutrition > (65) |
|---|
| Permanent URL | https://digital.nls.uk/190928195 |
|---|
| Description | Vol. 4. Statistics of food production, consumption and prices. |
|---|---|
| Shelfmark | LN.II.28.(4) |
| Attribution and copyright: |
|
| Shelfmark | LN.II |
|---|
| Description | Over 1,200 documents from the non-political organs of the League of Nations that dealt with health, disarmament, economic and financial matters for the duration of the League (1919-1945). Also online are statistical bulletins, essential facts, and an overview of the League by the first Secretary General, Sir Eric Drummond. These items are part of the Official Publications collection at the National Library of Scotland. |
|---|---|
| Additional NLS resources: |
|