Download files
Complete book:
Individual page:
Thumbnail gallery: Grid view | List view
— 172
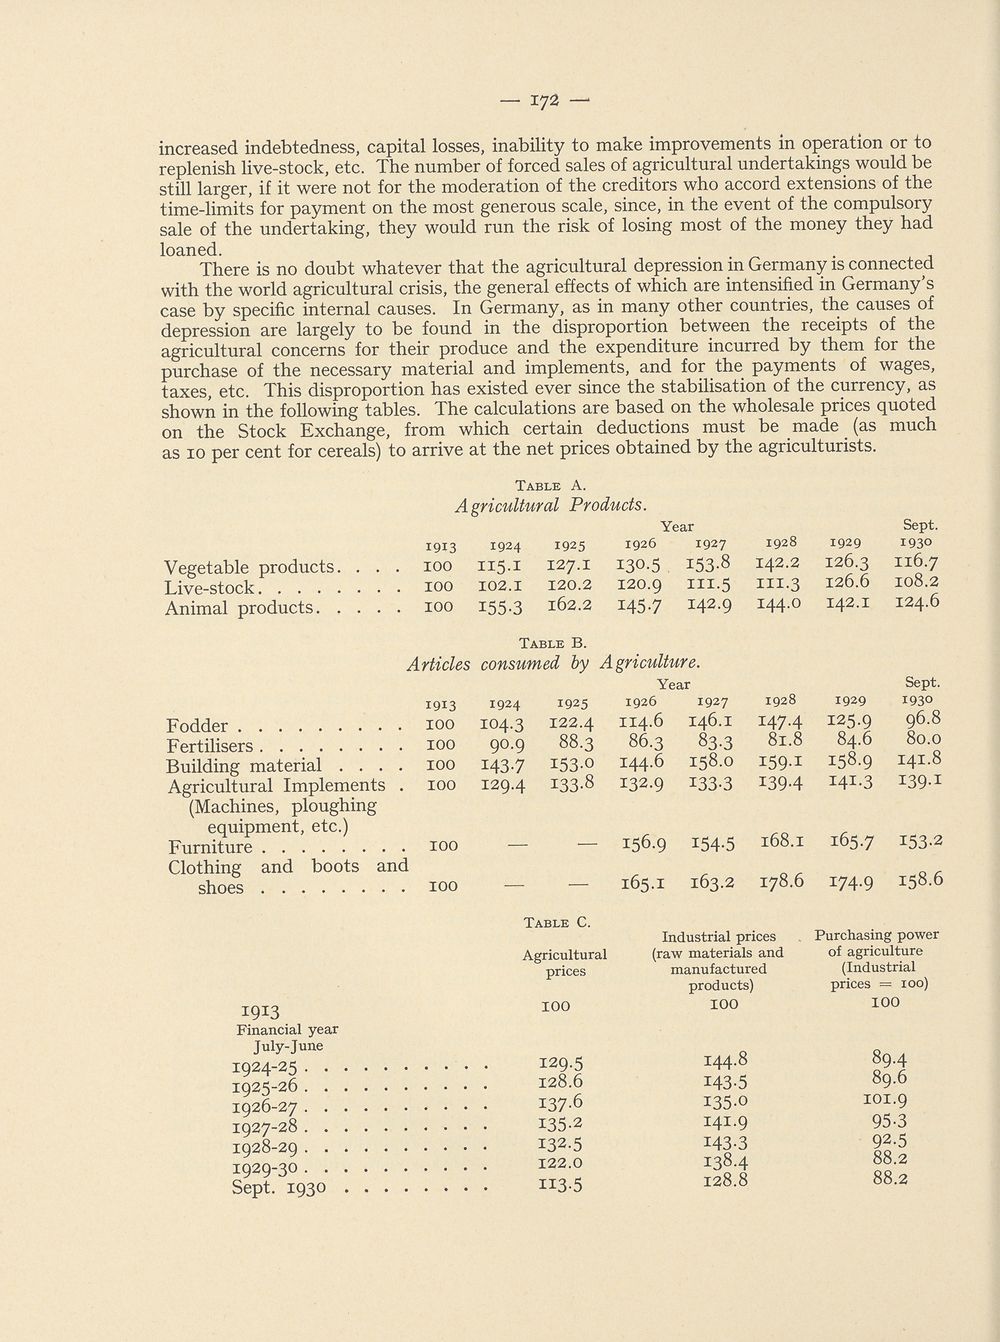
increased indebtedness, capital losses, inability to make improvements in operation or to
replenish live-stock, etc. The number of forced sales of agricultural undertakings would be
still larger, if it were not for the moderation of the creditors who accord extensions of the
time-limits for payment on the most generous scale, since, in the event of the compulsory
sale of the undertaking, they would run the risk of losing most of the money they had
loaned.
There is no doubt whatever that the agricultural depression in Germany is connected
with the world agricultural crisis, the general effects of which are intensified in Germany’s
case by specific internal causes. In Germany, as in many other countries, the causes of
depression are largely to be found in the disproportion between the receipts of the
agricultural concerns for their produce and the expenditure incurred by them for the
purchase of the necessary material and implements, and for the payments of wages,
taxes, etc. This disproportion has existed ever since the stabilisation of the currency, as
shown in the following tables. The calculations are based on the wholesale prices quoted
on the Stock Exchange, from which certain deductions must be made (as much
as 10 per cent for cereals) to arrive at the net prices obtained by the agriculturists.
Vegetable products.
Live-stock
Animal products. .
100
100
Fodder 100
Fertilisers 100
Building material . . .
Agricultural Implements
(Machines, ploughing
equipment, etc.)
Furniture 100
Clothing and boots and
shoes 100
Table A.
Agricultural Products.
Year
1913 1924 1925 1926 1927
100 115.1 127.i 130.5 153.8
100 102.1 120.2 120.9 III.5
100 155.3 162.2 145.7 142.9
Table B.
Articles consumed by Agriculture.
Year
1913 1924 1925 !926 1927
104.3 122.4 II4.6 I46.I
9O.9 88.3 86.3 83.3
143-7 I53-° 144-6 158.0
129.4 133-8 132.9
1928
142.2
in.3
144.0
1928
147.4
81.8
I59-1
139-4
— 156.9 154.5 168.1
— — 165.1 163.2 178.6
1929
126.3
126.6
142.1
1929
125.9
84.6
158.9
Sept.
1930
116.7
I08.2
124.6
Sept.
1930
96.8
80.O
141.8
I39-1
1657 I53-2
174.9 158.6
1913
Financial year
July-June
1924- 25 . .
1925- 26 . .
1926- 27 . .
1927- 28 . .
1928- 29 . .
1929- 30 . .
Sept. 1930
Table C.
Agricultural
prices
100
129-5
128.6
137.6
135-2
132-5
122.0
H3-5
Industrial prices
(raw materials and
manufactured
products)
100
144.8
143-5
i35-o
i4i-9
143-3
138.4
128.8
Purchasing power
of agriculture
(Industrial
prices = 100)
100
89.4
89.6
IOI.9
95-3
92.5
88.2
88.2
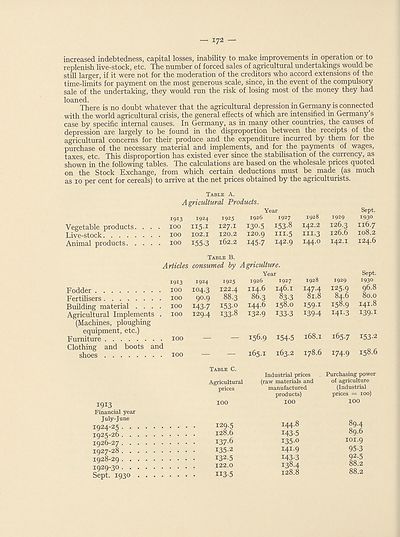
Set display mode to:
![]() Universal Viewer |
Universal Viewer | ![]() Mirador |
Large image | Transcription
Mirador |
Large image | Transcription
Images and transcriptions on this page, including medium image downloads, may be used under the Creative Commons Attribution 4.0 International Licence unless otherwise stated. ![]()
| League of Nations > Economic and financial section > Agricultural crisis > Volume 1 > (174) |
|---|
| Permanent URL | https://digital.nls.uk/190904912 |
|---|
| Shelfmark | LN.II.2/2.(35) |
|---|---|
| Attribution and copyright: |
|
| Shelfmark | LN.II.2/2.(35-35) |
|---|---|
| Shelfmark | LN.II |
|---|
| Description | Over 1,200 documents from the non-political organs of the League of Nations that dealt with health, disarmament, economic and financial matters for the duration of the League (1919-1945). Also online are statistical bulletins, essential facts, and an overview of the League by the first Secretary General, Sir Eric Drummond. These items are part of the Official Publications collection at the National Library of Scotland. |
|---|---|
| Additional NLS resources: |
|