Download files
Complete book:
Individual page:
Thumbnail gallery: Grid view | List view

— 94 —
depression, the area under cereals in the United States and Canada fell below the maximum
figure reached, but with the passing of the depression gradually regained its previous level.
In the meantime forces were at work, which had already exercised their influence
before the war on the technical side of overseas cereal production, but now made themselves
felt to a much greater extent under pressure of the post-war difficulties. The change in
question was the mechanisation of agricultural undertakings. This process has indeed
made great advances in all parts of the world, but nowhere on so important a scale as in the
areas of extensive grain cultivation. Among the main factors which contributed to
strengthen American agriculture were the growing use of tractors and mechanical mower-
and-threshers, and the progress made in the selection of seeds.
In the year 1920, there were in the United States of America 293,300 farms equipped
with tractors; by 1925 their number had risen to 473,800 and by 1928 500,000 additional
tractors were in use. The mower-and-thresher machine, which cuts, threshes and cleans
the grain, cheapens the cost of harvesting and does much to make the use of tractors more
profitable. The combination of tractors and mower-and-threshers now constitutes a
powerful weapon in the competition between extensive and intensive cultivation. In
the case of seeds, the introduction of an early ripening variety has extended the climatic
limits within which wheat can be grown, and so increased the area under that cereal. The
quality has been improved. The yield per hectare has also increased and is, in some
cases, higher than before the war. The figures of the average production in the Argentine
are some 30 per cent more than before the war—and they are relatively low.
The centre of gravity of the world’s cereal production has consequently shifted
during the war and post-war periods to the overseas countries. The world s statistics
of grain production are particularly well organised, and it is possible to arrive at an
accurate estimate of the position, thanks to the exhaustive enquiries which have been
made into the matter.
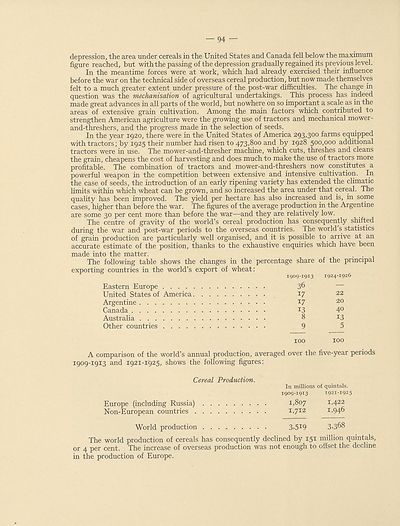
The following table shows the changes in the percentage share of the principal
exporting countries in the world’s export of wheat:
1909-1913 1924-1926
Eastern Europe 36
United States of America 17 22
Argentine I7 20
Canada I3 4°
Australia 8 13
Other countries 9 5
100 100
A comparison of the world’s annual production, averaged over the five-year periods
1909-1913 and 1921-1925, shows the following figures:
Cereal Production.
In millions of quintals.
1909-1913 1921-1925
Europe (including Russia) 1,807 i,422
Non-European countries i,712 I,946
World production 3>5I9 3368
The world production of cereals has consequently declined by 151 million quintals,
or 4 per cent. The increase of overseas production was not enough to offset the decline
in the production of Europe.
Set display mode to:
![]() Universal Viewer |
Universal Viewer | ![]() Mirador |
Large image | Transcription
Mirador |
Large image | Transcription
Images and transcriptions on this page, including medium image downloads, may be used under the Creative Commons Attribution 4.0 International Licence unless otherwise stated. ![]()
| League of Nations > Economic and financial section > Agricultural crisis > Volume 1 > (96) |
|---|
| Permanent URL | https://digital.nls.uk/190903898 |
|---|
| Shelfmark | LN.II.2/2.(35) |
|---|---|
| Attribution and copyright: |
|
| Shelfmark | LN.II.2/2.(35-35) |
|---|---|
| Shelfmark | LN.II |
|---|
| Description | Over 1,200 documents from the non-political organs of the League of Nations that dealt with health, disarmament, economic and financial matters for the duration of the League (1919-1945). Also online are statistical bulletins, essential facts, and an overview of the League by the first Secretary General, Sir Eric Drummond. These items are part of the Official Publications collection at the National Library of Scotland. |
|---|---|
| Additional NLS resources: |
|

