Download files
Complete book:
Individual page:
Thumbnail gallery: Grid view | List view
— 49
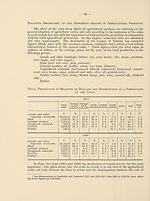
production and the sale prices are most marked in the case of cereals, but also because
agriculture obtains the greatest part of its total revenue from this source.
The order of importance of other groups did not change in the two years under
review. The production of meat ranked immediately after the cultivation of wheat ;
then came textile materials, colonial produce and the like, oleaginous materials and
rubber.
The value of all the groups has greatly increased as a result both of an increase
in production and of changes in the purchasing-power of gold ; but development has
not been uniform. While the total value of colonial produce, oleaginous materials,
textiles and rubber was approximately twice as high as the pre-war figures, the value
of meat production has increased to a smaller extent, while the value of the production
of cereals increased only by one-half.
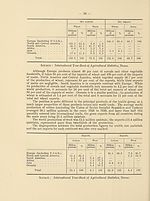
Characteristic details are revealed by comparing the percentage of production
in different continents. Europe’s share in production has decreased. The only exception
is in the group of textile raw materials and is explained by the inclusion of the production
of artificial silk. In the purely agricultural sphere, there has been a very marked decline
in the part played by Europe. The drop in the production of cereals in Europe is offset
by the increase in America and Oceania.
The changes are much less marked in meat production, but Europe has lost much
ground in the colonial produce group.
The greatest changes have taken place in the production of rubber. In 1913, South
America supplied 39.5 per cent and Africa 15.8 per cent of the total value of production.
In 1928, these two parts of the world only produced 4.7 per cent of the total, so that
Asia had an almost complete monopoly.
The extent of world trade in the products included in these groups and the proportion
in each group of the exports from different parts of the world are not in direct proportion
to the volume of production. This is accounted for by a series of reasons : the difference
in the consumption per head of the population, the different density of the population
in various producing districts, and finally, the unequal distribution of these districts
throughout the world in consequence of differences of soil and climate.
In this respect, the difference between wheat and rubber, for example, is very
marked. All wheat-producing countries consume part on the spot and only export the
surplus. Even the countries with the greatest deficit in the production of wheat cover
part of their needs from their own production. On the other hand, rubber is produced
in areas which consume only insignificant quantities, while the great consuming
districts produce practically none. The quantities entering international trade therefore
represent a much greater proportion of the output in the second case than in the
first.
It is impossible to estimate the exports of products included in the index numbers
of the above table in such a way as to make these figures strictly comparable with the
figures for production. But, on examining the part played by the export of some of
the principal agricultural products in each continent, great inequalities may be noted,
which show even more clearly than the index number of production the great
differences in the problems arising in each continent in connection with the various
branches of agriculture.
The average world production of wheat from 1926 to 1929 (excluding China and
Turkey) was 1,200 million quintals, but the gross exports from all countries was only
194.2 million quintals, or less than one-sixth of this quantity. An even larger propor¬
tion of maize was consumed in the producing countries. Though the average production
was about 1,113.9 million quintals, the gross exports only reached 92.1 million quintals,
or less than one-twelfth. The net exports from each continent were entirely dispro¬
portionate to the percentages of the total production of cereals and vegetable foodstuffs
of the same continents.
production and the sale prices are most marked in the case of cereals, but also because
agriculture obtains the greatest part of its total revenue from this source.
The order of importance of other groups did not change in the two years under
review. The production of meat ranked immediately after the cultivation of wheat ;
then came textile materials, colonial produce and the like, oleaginous materials and
rubber.
The value of all the groups has greatly increased as a result both of an increase
in production and of changes in the purchasing-power of gold ; but development has
not been uniform. While the total value of colonial produce, oleaginous materials,
textiles and rubber was approximately twice as high as the pre-war figures, the value
of meat production has increased to a smaller extent, while the value of the production
of cereals increased only by one-half.
Characteristic details are revealed by comparing the percentage of production
in different continents. Europe’s share in production has decreased. The only exception
is in the group of textile raw materials and is explained by the inclusion of the production
of artificial silk. In the purely agricultural sphere, there has been a very marked decline
in the part played by Europe. The drop in the production of cereals in Europe is offset
by the increase in America and Oceania.
The changes are much less marked in meat production, but Europe has lost much
ground in the colonial produce group.
The greatest changes have taken place in the production of rubber. In 1913, South
America supplied 39.5 per cent and Africa 15.8 per cent of the total value of production.
In 1928, these two parts of the world only produced 4.7 per cent of the total, so that
Asia had an almost complete monopoly.
The extent of world trade in the products included in these groups and the proportion
in each group of the exports from different parts of the world are not in direct proportion
to the volume of production. This is accounted for by a series of reasons : the difference
in the consumption per head of the population, the different density of the population
in various producing districts, and finally, the unequal distribution of these districts
throughout the world in consequence of differences of soil and climate.
In this respect, the difference between wheat and rubber, for example, is very
marked. All wheat-producing countries consume part on the spot and only export the
surplus. Even the countries with the greatest deficit in the production of wheat cover
part of their needs from their own production. On the other hand, rubber is produced
in areas which consume only insignificant quantities, while the great consuming
districts produce practically none. The quantities entering international trade therefore
represent a much greater proportion of the output in the second case than in the
first.
It is impossible to estimate the exports of products included in the index numbers
of the above table in such a way as to make these figures strictly comparable with the
figures for production. But, on examining the part played by the export of some of
the principal agricultural products in each continent, great inequalities may be noted,
which show even more clearly than the index number of production the great
differences in the problems arising in each continent in connection with the various
branches of agriculture.
The average world production of wheat from 1926 to 1929 (excluding China and
Turkey) was 1,200 million quintals, but the gross exports from all countries was only
194.2 million quintals, or less than one-sixth of this quantity. An even larger propor¬
tion of maize was consumed in the producing countries. Though the average production
was about 1,113.9 million quintals, the gross exports only reached 92.1 million quintals,
or less than one-twelfth. The net exports from each continent were entirely dispro¬
portionate to the percentages of the total production of cereals and vegetable foodstuffs
of the same continents.
Set display mode to:
![]() Universal Viewer |
Universal Viewer | ![]() Mirador |
Large image | Transcription
Mirador |
Large image | Transcription
Images and transcriptions on this page, including medium image downloads, may be used under the Creative Commons Attribution 4.0 International Licence unless otherwise stated. ![]()
| League of Nations > Economic and financial section > Agricultural crisis > Volume 1 > (51) |
|---|
| Permanent URL | https://digital.nls.uk/190903313 |
|---|
| Shelfmark | LN.II.2/2.(35) |
|---|---|
| Attribution and copyright: |
|
| Shelfmark | LN.II.2/2.(35-35) |
|---|---|
| Shelfmark | LN.II |
|---|
| Description | Over 1,200 documents from the non-political organs of the League of Nations that dealt with health, disarmament, economic and financial matters for the duration of the League (1919-1945). Also online are statistical bulletins, essential facts, and an overview of the League by the first Secretary General, Sir Eric Drummond. These items are part of the Official Publications collection at the National Library of Scotland. |
|---|---|
| Additional NLS resources: |
|