Medicine - Vaccination > 1911-1928 - Annual vaccination report of Bihar and Orissa > 1923-1924 - Annual statistical return and short notes on vaccination in Bihar and Orissa for the year 1923-24
(439) Page 12
‹‹‹ prev (438)
Half title page
Download files
Individual page:
Thumbnail gallery: Grid view | List view

12
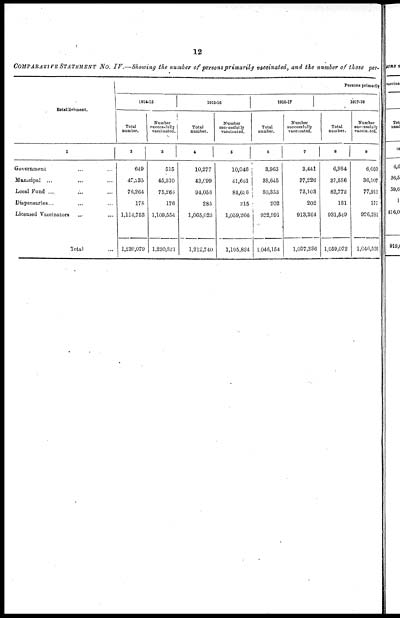
COMPARATIVE STATEMENT No. IV.—Showing the number of persons primarily vaccinated, and the number of those per-
|
Establishment. |
Persons primarily |
|||||||
|
1914-15 |
1915-16 |
1916-17 |
1917-18 |
|||||
|
Total |
Number |
Total |
Number |
Total |
Number |
Total |
Number |
|
|
1 |
2 |
3 |
4 |
5 |
6 |
7 |
8 |
9 |
|
Government ... ... |
649 |
515 |
10,277 |
10,046 |
3,963 |
3,441 |
6,984 |
6,050 |
|
Municipal ... ... ... |
47,235 |
45,310 |
43,099 |
41,661 |
38,645 |
37,226 |
37,586 |
36,107 |
|
Local Fund ... ... ... |
76,264 |
75,266 |
94,056 |
84,656 |
80,353 |
73,103 |
82,772 |
77,911 |
|
Dispensaries... ... ... |
178 |
176 |
285 |
215 |
202 |
202 |
181 |
177 |
|
Licensed Vaccinators ... ... |
1,114,753 |
1,109,554 |
1,065,023 |
1,059,266 |
922,991 |
913,264 |
931,549 |
926,281 |
|
Total ... |
1,239,079 |
1,230,821 |
1,212,740 |
1,195,824 |
1,046,154 |
1,027,236 |
1,059,072 |
1,046,526 |
Set display mode to: Large image | Zoom image | Transcription
Images and transcriptions on this page, including medium image downloads, may be used under the Creative Commons Attribution 4.0 International Licence unless otherwise stated. ![]()
| Permanent URL | https://digital.nls.uk/91545386 |
|---|


