Medicine - Vaccination > 1911-1928 - Annual vaccination report of Bihar and Orissa > 1915-1916 - Annual statistical returns and short notes on vaccination in Bihar and Orissa for the year 1915-16
(145) Page 12
‹‹‹ prev (144)
Half title page
Download files
Individual page:
Thumbnail gallery: Grid view | List view

12
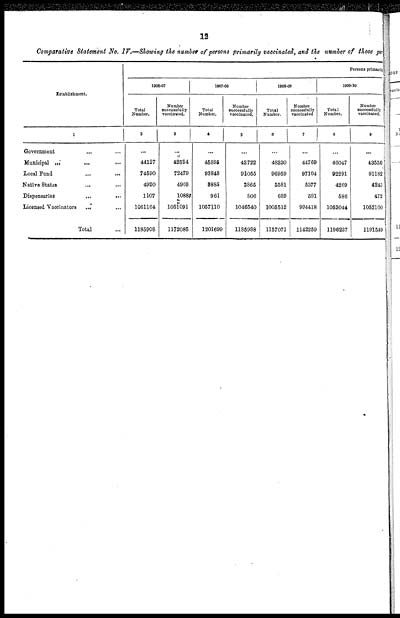
Comparative Statement No. IV.—Showing the number of persons primarily vaccinated, and the number of those per
|
Establishment. |
Persons primarily |
|||||||
|
1906-07 |
1907-08 |
1908-09 |
1909-10 |
|||||
|
Total |
Number |
Total |
Number |
Total |
Number |
Total |
Number |
|
|
1 |
2 |
3 |
4 |
5 |
6 |
7 |
8 |
9 |
|
Government ... ... |
... |
... |
... |
... |
... |
... |
... |
... |
|
Municipal ... ... ... |
44127 |
42524 |
45895 |
43722 |
48330 |
44769 |
46047 |
43550 |
|
Local Fund ... ... |
74590 |
72479 |
93848 |
91055 |
96959 |
97104 |
92291 |
91182 |
|
Native States ... ... |
4920 |
4903 |
3885 |
3865 |
5581 |
5377 |
4269 |
4245 |
|
Dispensaries ... ... |
1107 |
1088 |
961 |
806 |
689 |
591 |
586 |
472 |
|
Licensed Vaccinators ... ... |
1061164 |
1051091 |
1057110 |
1046540 |
1005512 |
994418 |
1053044 |
1052100 |
|
Total ... |
1185908 |
1172085 |
1201699 |
1185988 |
1157071 |
1142259 |
1196237 |
1191549 |
Set display mode to: Large image | Zoom image | Transcription
Images and transcriptions on this page, including medium image downloads, may be used under the Creative Commons Attribution 4.0 International Licence unless otherwise stated. ![]()
| Permanent URL | https://digital.nls.uk/91544332 |
|---|


