Medicine - Vaccination > 1911-1928 - Annual vaccination report of Bihar and Orissa > 1912-1913 - Vaccination return on the districts of Bihar and Orissa for the year 1912-13
(62) Page 6
Download files
Individual page:
Thumbnail gallery: Grid view | List view

6
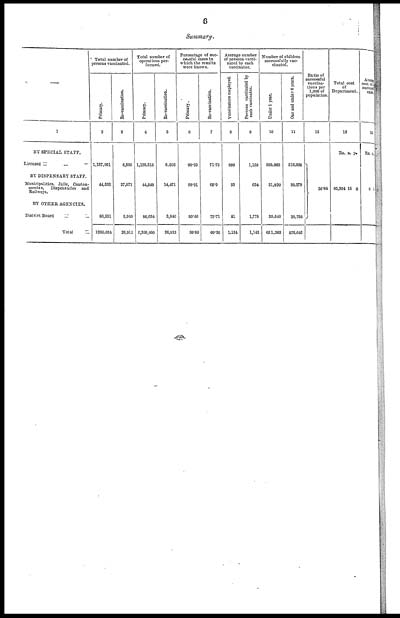
Summary.
|
— |
Total number of |
Total number of |
Percentage of suc- |
Average number |
Number of children |
Ratio of |
Total cost |
Avera |
||||||||
|
Primary. |
Re-vaccination. |
Primary. |
Re-vaccination. |
Primary. |
Re-vaccination. |
Vaccinators employed. |
Persons vaccinated by |
Under 1 year. |
One and under 6 years. |
|||||||
|
1 |
2 |
3 |
4 |
5 |
6 |
7 |
8 |
9 |
10 |
11 |
12 |
13 |
14 |
|||
|
BY SPECIAL STAFF. |
Rs. |
a. |
P. |
Rs. |
a. |
|||||||||||
|
Licensed ... ... ... ... |
1,137,951 |
8,500 |
1,138,218 |
8,502 |
99.63 |
71.75 |
990 |
1,158 |
589,903 |
516,608 |
36.84 |
82,304 |
15 |
8 |
0 |
1 |
|
BY DISPENSARY STAFF. |
||||||||||||||||
|
Municipalities, Jails, Canton- |
44,532 |
27,971 |
41,548 |
14,471 |
98.91 |
65.0 |
93 |
634 |
21,820 |
20,279 |
||||||
|
BY OTHER AGENCIES. |
||||||||||||||||
|
District Board ... ... ... ... |
86,551 |
3,940 |
86,634 |
3,940 |
99.46 |
75.71 |
51 |
1,775 |
39,540 |
38,758 |
||||||
|
Total... |
1269,034 |
26,911 |
2,269,400 |
26,913 |
99.59 |
69.35 |
1,134 |
1,142 |
651,263 |
575,645 |
||||||
Set display mode to: Large image | Zoom image | Transcription
Images and transcriptions on this page, including medium image downloads, may be used under the Creative Commons Attribution 4.0 International Licence unless otherwise stated. ![]()
| India Papers > Medicine - Vaccination > Annual vaccination report of Bihar and Orissa > Vaccination return on the districts of Bihar and Orissa for the year 1912-13 > (62) Page 6 |
|---|
| Permanent URL | https://digital.nls.uk/91544047 |
|---|


