Medicine - Vaccination > 1911-1928 - Annual vaccination report of Bihar and Orissa > 1911-1914 - Triennial report on vaccination, Bihar and Orissa, for the years 1911-12, 1912-13 & 1913-14
(28) Page 12
Download files
Individual page:
Thumbnail gallery: Grid view | List view

12
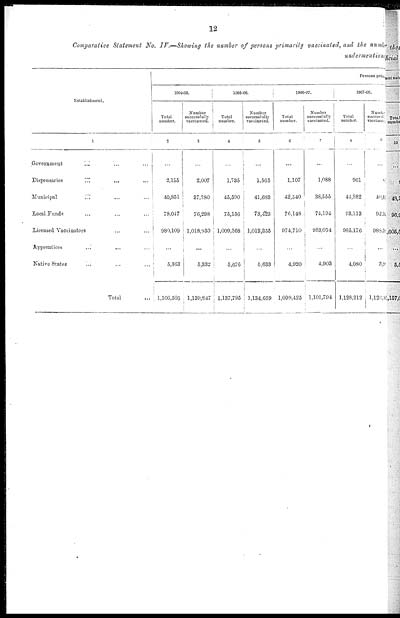
Comparative Statement No. IV.—Showing the number of persons primarily vaccinated, and the number
undermentioned
|
Establishment. |
Persons primary |
|||||||
|
1904-05. |
1905-06. |
1906-07. |
1907-08. |
|||||
|
Total |
Number |
Total |
Number |
Total |
Number |
Total |
Number |
|
|
1 |
2 |
3 |
4 |
5 |
6 |
7 |
8 |
9 |
|
Government ... ... ... |
... |
... |
... |
... |
... |
... |
... |
... |
|
Dispensaries ... ... ... |
2,185 |
2,007 |
1,735 |
1,565 |
1,107 |
1,088 |
961 |
87 |
|
Municipal ... ... ... |
40,851 |
37,280 |
45,590 |
41,683 |
42,540 |
38,555 |
44,882 |
40,83 |
|
Local Funds ... ... ... |
78,047 |
70,298 |
75,156 |
73,423 |
76,148 |
74,194 |
93,113 |
92,34 |
|
Licensed Vaccinators ... ... ... |
980,109 |
1,018,930 |
1,009,368 |
1,012,355 |
974,710 |
983,054 |
985,176 |
988,38 |
|
Apprentices ... ... ... |
... |
... |
... |
... |
... |
... |
... |
... |
|
Satire States ... ... ... |
5,363 |
5,332 |
5,676 |
5,633 |
4,920 |
4,903 |
4,080 |
3,98 |
|
Total ... |
1,106,505 |
1,139,847 |
1,137,795 |
1,134,659 |
1,099,425 |
1,101,794 |
1,128,212 |
1,126,34 |
Set display mode to: Large image | Zoom image | Transcription
Images and transcriptions on this page, including medium image downloads, may be used under the Creative Commons Attribution 4.0 International Licence unless otherwise stated. ![]()
| Permanent URL | https://digital.nls.uk/91543938 |
|---|


