Medicine - Vaccination > 1909-1929 - Annual statistical returns and brief notes on vaccination in Bengal > 1915-1916 - Annual statistical returns and short notes on vaccination in Bengal for the year 1915-16
(255) Page vi
Download files
Individual page:
Thumbnail gallery: Grid view | List view

vi
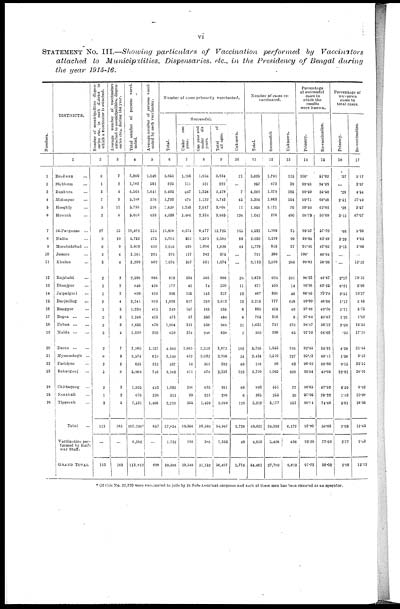
STATEMENT NO. III.—Showing particulars of Vaccination performed by Vaccinators
attached to Municipalities, Dispensaries, etc., in the Presidency of Bengal during
the year 1915-16.
|
Numbers. |
DISTRICTS. |
Number of municipalities dispen- |
Average number of vaccinators |
Total number of persons vacci- |
Average number of persons vacci- |
Number of cases primarily vaccinated, |
Number of cases re- |
Percentage |
Percentage of |
||||||||
|
Total. |
Successful. |
Unknown. |
Total. |
Successful. |
Unknown. |
Primary. |
Re-vaccination. |
Primary. |
Re-veccination. |
||||||||
|
Under one |
One year and |
Total of |
|||||||||||||||
|
1 |
2 |
3 |
4 |
5 |
6 |
7 |
8 |
9 |
10 |
11 |
12 |
13 |
14 |
15 |
16 |
17 |
|
|
1 |
Burdwan ... |
6 |
7 |
7,280 |
1,040 |
3,655 |
1,186 |
1,956 |
3,634 |
21 |
3,625 |
1,791 |
115 |
100. |
51.02 |
.57 |
3.17 |
|
2 |
Birbhum ... |
1 |
2 |
1,182 |
591 |
225 |
111 |
101 |
222 |
... |
957 |
872 |
38 |
98.68 |
94.88 |
... |
3.97 |
|
3 |
Bankura ... |
3 |
4 |
6,564 |
1,641 |
2,495 |
647 |
1,356 |
2,478 |
7 |
4,069 |
1,379 |
185 |
99.59 |
35.50 |
.28 |
4.54 |
|
4 |
Midnapur ... |
7 |
9 |
5,188 |
576 |
1,703 |
474 |
1,132 |
1,743 |
45 |
3,396 |
1,863 |
594 |
99.71 |
66.48 |
2.51 |
17.49 |
|
6 |
Hooghly ... |
9 |
11 |
5,785 |
526 |
2,838 |
1,245 |
2,047 |
3,808 |
11 |
1,958 |
1,171 |
70 |
99.50 |
62.02 |
.28 |
3.57 |
|
6 |
Howrah ... |
2 |
8 |
5,063 |
633 |
4,038 |
1,486 |
2,334 |
3,865 |
126 |
1,041 |
276 |
490 |
98.79 |
50.00 |
3.12 |
47.07 |
|
7 |
24-Parganas ... |
27 |
35 |
19,402 |
554 |
15,898 |
6,674 |
8,477 |
15,725 |
105 |
3,532 |
1,995 |
75 |
90.57 |
57.70 |
.66 |
2.96 |
|
8 |
Nadia ... |
9 |
10 |
4,752 |
475 |
2,702 |
903 |
1,559 |
2,588 |
89 |
2,050 |
1,219 |
99 |
99.04 |
62.48 |
3.29 |
4.82 |
|
9 |
Murshidabad ... |
6 |
9 |
3,819 |
424 |
2,066 |
625 |
1,096 |
1,828 |
44 |
1,770 |
815 |
37 |
90.40 |
47.02 |
2.13 |
2.09 |
|
10 |
Jessore ... |
3 |
4 |
1,163 |
291 |
375 |
117 |
242 |
375 |
... |
791 |
380 |
... |
100. |
48.04 |
... |
... |
|
11 |
Khulna ... |
3 |
4 |
3,209 |
802 |
1,076 |
367 |
531 |
1,074 |
... |
2,133 |
1,076 |
280 |
99.81 |
58.06 |
... |
13.12 |
|
12 |
Rajshahi ... |
2 |
3 |
2,598 |
866 |
919 |
334 |
505 |
866 |
20 |
1,679 |
604 |
321 |
96.33 |
44.47 |
2.17 |
19.12 |
|
13 |
Dinajpur ... |
1 |
2 |
848 |
424 |
177 |
42 |
74 |
150 |
11 |
671 |
409 |
14 |
90.36 |
62.25 |
6.21 |
2.08 |
|
14 |
Jalpaiguri ... |
1 |
2 |
820 |
410 |
398 |
135 |
143 |
337 |
10 |
467 |
305 |
48 |
86.85 |
72.79 |
2.51 |
10.27 |
|
15 |
Darjeeling ... |
2 |
4 |
3,241 |
810 |
1,026 |
517 |
259 |
1,012 |
12 |
2,215 |
777 |
628 |
99.80 |
48.06 |
1.17 |
2.83 |
|
16 |
Rangpur ... |
1 |
3 |
1,231 |
411 |
349 |
157 |
163 |
335 |
6 |
885 |
416 |
49 |
97.66 |
49.76 |
1.71 |
5.73 |
|
17 |
Bogra ... ... |
2 |
3 |
1,246 |
415 |
473 |
67 |
350 |
456 |
6 |
785 |
316 |
8 |
97.64 |
40.67 |
1.26 |
1.02 |
|
18 |
Pabna ... ... |
2 |
3 |
2,635 |
878 |
1,004 |
331 |
538 |
968 |
21 |
1,631 |
791 |
270 |
98.47 |
58.12 |
2.09 |
16.55 |
|
19 |
Malda ... ... |
3 |
4 |
1,039 |
259 |
659 |
374 |
248 |
638 |
2 |
380 |
208 |
65 |
97.10 |
66.03 |
.30 |
17.10 |
|
20 |
Dacca ... ... |
2 |
7 |
7,960 |
1,137 |
4,380 |
1,665 |
2,119 |
3,872 |
192 |
3,705 |
1,045 |
795 |
92.45 |
35.91 |
4.38 |
21.45 |
|
21 |
Mymensingh ... |
8 |
9 |
5,574 |
619 |
3,140 |
612 |
2,032 |
2,958 |
34 |
2,434 |
1,510 |
227 |
95.23 |
68.41 |
1.08 |
9.32 |
|
22 |
Faridpur ... |
2 |
2 |
625 |
312 |
437 |
34 |
301 |
382 |
40 |
188 |
86 |
63 |
96.22 |
68.80 |
9.15 |
33.51 |
|
23 |
Bakarganj ... |
5 |
8 |
5,968 |
746 |
3,169 |
611 |
678 |
2,337 |
723 |
2,799 |
1,065 |
628 |
95.54 |
49.05 |
22.81 |
26.01 |
|
24 |
Chittagong ... |
2 |
3 |
1,925 |
642 |
1,032 |
248 |
635 |
951 |
68 |
893 |
551 |
77 |
98.65 |
67.52 |
6.59 |
8.62 |
|
25 |
Noakhali ... |
1 |
2 |
676 |
338 |
311 |
39 |
231 |
296 |
6 |
365 |
255 |
39 |
97.05 |
78.22 |
1.93 |
10.68 |
|
26 |
Tipperah ... |
3 |
5 |
7,431 |
1,486 |
2,219 |
355 |
1,459 |
2,049 |
129 |
5,212 |
3,177 |
357 |
98.04 |
74.66 |
5.81 |
18.36 |
|
Total ... |
113 |
163 |
107,230* |
657 |
57,854 |
19,356 |
30,566 |
54,947 |
1,728 |
49,631 |
24,352 |
6,172 |
97.90 |
56.03 |
2.09 |
12.43 |
|
|
Vaccination per- |
... |
... |
6,582 |
... |
1,732 |
192 |
586 |
1,550 |
48 |
4,850 |
3,428 |
438 |
9220 |
77.69 |
2.77 |
9.03 |
|
|
GRAND TOTAL |
113 |
163 |
113,812 |
698 |
59,586 |
19,548 |
31,152 |
56,497 |
1,776 |
54,481 |
27,780 |
6,610 |
97.73 |
58.03 |
2.98 |
12.13 |
|
* Of this No. 22,220 were vaccinated in jails by 24 Sub-Assistant surgeons and each of these men has been counted as an operator.
Set display mode to: Large image | Zoom image | Transcription
Images and transcriptions on this page, including medium image downloads, may be used under the Creative Commons Attribution 4.0 International Licence unless otherwise stated. ![]()
| Permanent URL | https://digital.nls.uk/91542262 |
|---|
| Additional NLS resources: | |
|---|---|


