

Medicine - Vaccination > 1896-1909 - Annual statistical returns and brief notes on vaccination in Bengal > 1902-1905 - Sixth triennial report of vaccination in Bengal during the years 1902-1903, 1903-1904 and 1904-1905
(339) Page ii
‹‹‹ prev (338)
Half title page
Download files
Individual page:
Thumbnail gallery: Grid view | List view
ii
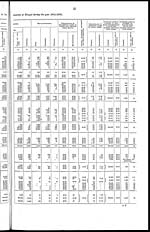
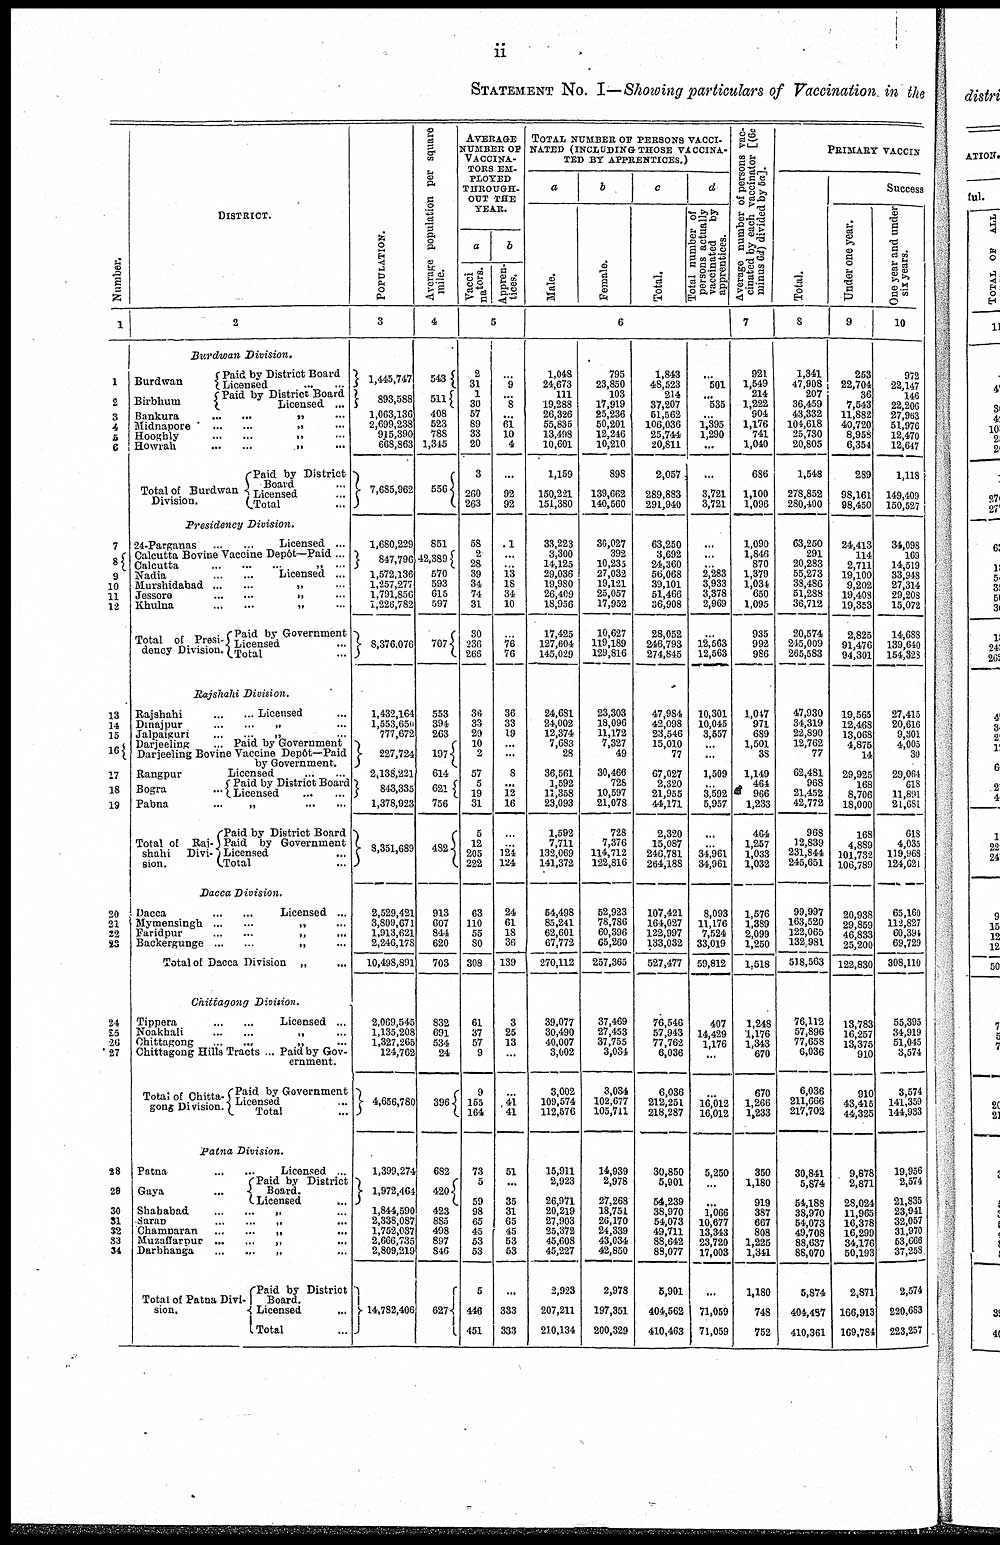
STATEMENT No. I—Showing particulars of Vaccination in the
|
Number. |
DISTRICT. |
POPULATION. |
Average population per square |
AVERAGE |
TOTAL NUMBER OF PERSONS VACCI- |
Average number of persons vac- |
PRIMARY VACCIN |
||||||||
|
a |
b |
c |
d |
Total. |
Success |
||||||||||
|
Male. |
Female. |
Total. |
Total number of |
Under one year. |
One year and under |
||||||||||
|
a |
b |
||||||||||||||
|
Vacci |
Appren- |
||||||||||||||
|
1 |
2 |
3 |
4 |
5 |
6 |
7 |
8 |
9 |
10 |
||||||
|
Burdwan Division. |
|||||||||||||||
|
1 |
Burdwan |
Paid by District Board |
1,445,747 |
543 |
2 |
... |
1,048 |
795 |
1,843 |
... |
921 |
1,341 |
253 |
972 |
|
|
Licensed ... ... |
31 |
9 |
24,673 |
23,850 |
48,523 |
501 |
1,549 |
47,908 |
22,704 |
22,147 |
|||||
|
2 |
Birbhum |
Paid by District Board |
893,588 |
511 |
1 |
... |
111 |
103 |
214 |
... |
214 |
207 |
36 |
146 |
|
|
Licensed ... |
30 |
8 |
19,288 |
17,919 |
37,207 |
535 |
1,222 |
36,459 |
7,543 |
22,206 |
|||||
|
3 |
Bankura ... ... „ ... |
1,063,136 |
408 |
57 |
... |
26,326 |
25,236 |
51,562 |
... |
904 |
43,332 |
11,882 |
27,963 |
||
|
4 |
Midnapore ... ... „ ... |
2,699,238 |
523 |
89 |
61 |
55,835 |
50,201 |
106,036 |
1,395 |
1,176 |
104,618 |
40,720 |
51,976 |
||
|
5 |
Hooghly ... ... „ ... |
915,390 |
788 |
33 |
10 |
13,498 |
12,246 |
25,744 |
1,290 |
741 |
25,730 |
8,958 |
12,470 |
||
|
6 |
Howrah ... ... „ ... |
668,863 |
1,345 |
20 |
4 |
10,601 |
10,210 |
20,811 |
... |
1,040 |
20,805 |
6,354 |
12,647 |
||
|
Total of Burdwan |
Paid by District |
7,685,962 |
556 |
3 |
... |
1,159 |
898 |
2,057 |
... |
686 |
1,548 |
289 |
1,118 |
||
|
Licensed ... |
260 |
92 |
150,221 |
139,662 |
289,883 |
3,721 |
1,100 |
278,852 |
98,161 |
149,409 |
|||||
|
Total ... |
263 |
92 |
151,380 |
140,560 |
291,940 |
3,721 |
1,096 |
280,400 |
98,450 |
150,527 |
|||||
|
Presidency Division. |
|||||||||||||||
|
7 |
24-Parganas ... ... Licensed ... |
1,680,229 |
851 |
58 |
1 |
33,223 |
30,027 |
63,250 |
... |
1,090 |
63,250 |
24,413 |
34,098 |
||
|
8 |
Calcutta Bovine Vaccine Depôt—Paid ... |
847,796 |
42,389 |
2 |
... |
3,300 |
392 |
3,692 |
... |
1,846 |
291 |
114 |
169 |
||
|
Calcutta ... ... „ ... |
28 |
... |
14,125 |
10,235 |
24,360 |
... |
870 |
20,283 |
2,711 |
14,519 |
|||||
|
9 |
Nadia ... ... Licensed ... |
1,572,136 |
570 |
39 |
13 |
29,036 |
27,032 |
56,068 |
2,283 |
1,379 |
55,273 |
19,100 |
33,948 |
||
|
10 |
Murshidabad ... ... „ ... |
1,257,277 |
593 |
34 |
18 |
19,980 |
19,121 |
39,101 |
3,933 |
1,034 |
38,486 |
9,202 |
27,314 |
||
|
11 |
Jessore ... ... „ ... |
1,791,856 |
615 |
74 |
34 |
26,409 |
25,057 |
51,466 |
3,378 |
650 |
51,288 |
19,408 |
29,208 |
||
|
12 |
Khulna ... ... „ ... |
1,226,782 |
597 |
31 |
10 |
18,956 |
17,952 |
36,908 |
2,969 |
1,095 |
36,712 |
19,353 |
15,072 |
||
|
Total of Presi- |
Paid by Government |
8,376,076 |
707 |
30 |
... |
17,425 |
10,627 |
28,052 |
... |
935 |
20,574 |
2,825 |
14,688 |
||
|
Licensed ... |
236 |
76 |
127,604 |
119,189 |
246,793 |
12,563 |
992 |
245,009 |
91,476 |
139,640 |
|||||
|
Total ... |
266 |
76 |
145,029 |
129,816 |
274,845 |
12,563 |
986 |
265,583 |
94,301 |
154,328 |
|||||
|
Rajshahi Division. |
|||||||||||||||
|
13 |
Rajshahi ... ... Licensed ... |
1,432,164 |
553 |
36 |
36 |
24,681 |
23,303 |
47,984 |
10,301 |
1,047 |
47,930 |
19,565 |
27,415 |
||
|
14 |
Dinajpur ... ... „ ... |
1,553,650 |
394 |
33 |
33 |
24,002 |
18,096 |
42,098 |
10,045 |
971 |
34,319 |
12,468 |
20,616 |
||
|
15 |
Jalpaiguri ... ... „ ... |
777,672 |
263 |
29 |
19 |
12,374 |
11,172 |
23,546 |
3,557 |
689 |
22,890 |
13,068 |
9,301 |
||
|
16 |
Darjeeling ... Paid by Government |
227,724 |
197 |
10 |
... |
7,683 |
7,327 |
15,010 |
... |
1,501 |
12,762 |
4,875 |
4,005 |
||
|
Darjeeling Bovine Vaccine Depôt—Paid |
2 |
... |
28 |
49 |
77 |
... |
38 |
77 |
14 |
30 |
|||||
|
17 |
Rangpur Licensed ... ... |
2,138,221 |
614 |
57 |
8 |
36,561 |
30,466 |
67,027 |
1,509 |
1,149 |
62,481 |
29,925 |
29,064 |
||
|
18 |
Bogra ... |
Paid by District Board |
843,335 |
621 |
5 |
... |
1,592 |
728 |
2,320 |
... |
464 |
968 |
168 |
618 |
|
|
Licensed ... ... |
19 |
12 |
11,358 |
10,597 |
21,955 |
3,592 |
966 |
21,452 |
8,706 |
11,891 |
|||||
|
19 |
Pabna ... „ ... ... |
1,378,923 |
756 |
31 |
16 |
23,093 |
21,078 |
44,171 |
5,957 |
1,233 |
42,772 |
18,000 |
21,681 |
||
|
Total of Raj- |
Paid by District Board |
8,351,689 |
482 |
5 |
... |
1,592 |
728 |
2,320 |
... |
464 |
968 |
168 |
618 |
||
|
Paid by Government |
12 |
... |
7,711 |
7,376 |
15,087 |
... |
1,257 |
12,839 |
4,889 |
4,035 |
|||||
|
Licensed ... |
205 |
124 |
132,069 |
114,712 |
246,781 |
34,961 |
1,033 |
231,844 |
101,732 |
119,968 |
|||||
|
Total ... |
222 |
124 |
141,372 |
122,816 |
264,188 |
34,961 |
1,032 |
245,651 |
106,789 |
124,621 |
|||||
|
Dacca Division. |
|||||||||||||||
|
20 |
Dacca ... ... Licensed ... |
2,529,421 |
913 |
63 |
24 |
54,498 |
52,923 |
107,421 |
8,093 |
1,576 |
99,997 |
20,938 |
65,160 |
||
|
21 |
Mymensingh ... ... „ ... |
3,809,671 |
607 |
110 |
61 |
85,241 |
78,786 |
164,027 |
11,176 |
1,389 |
163,520 |
29,859 |
112,827 |
||
|
22 |
Faridpur ... ... „ ... |
1,913,621 |
844 |
55 |
18 |
62,601 |
60,396 |
122,997 |
7,524 |
2,099 |
122,065 |
46,833 |
60,394 |
||
|
23 |
Backergunge ... ... „ ... |
2,246,178 |
620 |
80 |
36 |
67,772 |
65,260 |
133,032 |
33,019 |
1,250 |
132,981 |
25,200 |
69,729 |
||
|
Total of Dacca Division „ ... |
10,498,891 |
703 |
308 |
139 |
270,112 |
257,365 |
527,477 |
59,812 |
1,518 |
518,563 |
122,830 |
308,110 |
|||
|
Chittagong Division. |
|||||||||||||||
|
24 |
Tippera ... ... Licensed ... |
2,069,545 |
832 |
61 |
3 |
39,077 |
37,469 |
76,546 |
407 |
1,248 |
76,112 |
13,783 |
55,395 |
||
|
25 |
Noakhali ... ... „ ... |
1,135,208 |
691 |
37 |
25 |
30,490 |
27,453 |
57,943 |
14,429 |
1,176 |
57,896 |
16,257 |
34,919 |
||
|
26 |
Chittagong ... ... „ ... |
1,327,265 |
534 |
57 |
13 |
40,007 |
37,755 |
77,762 |
1,176 |
1,343 |
77,658 |
13,375 |
51,045 |
||
|
27 |
Chittagong Hills Tracts ... Paid by Gov- |
124,762 |
24 |
9 |
... |
3,002 |
3,034 |
6,036 |
... |
670 |
6,036 |
910 |
3,574 |
||
|
Total of Chitta- |
Paid by Government |
4,656,780 |
396 |
9 |
... |
3,002 |
3,034 |
6,036 |
... |
670 |
6,036 |
910 |
3,574 |
||
|
Licensed ... |
155 |
41 |
109,574 |
102,677 |
212,251 |
16,012 |
1,266 |
211,666 |
43,415 |
141,359 |
|||||
|
Total ... |
164 |
41 |
112,576 |
105,711 |
218,287 |
16,012 |
1,233 |
217,702 |
44,325 |
144,933 |
|||||
|
Patna Division. |
|||||||||||||||
|
28 |
Patna ... ... Licensed ... |
1,399,274 |
682 |
73 |
51 |
15,911 |
14,939 |
30,850 |
5,250 |
350 |
30,841 |
9,878 |
19,956 |
||
|
28 |
Gaya ... |
Paid by District |
1,972,464 |
420 |
5 |
... |
2,923 |
2,978 |
5,901 |
... |
1,180 |
5,874 |
2,871 |
2,574 |
|
|
Licensed ... |
59 |
35 |
26,971 |
27,268 |
54,239 |
... |
919 |
54,188 |
28,024 |
21,835 |
|||||
|
30 |
Shababad ... ... „ ... |
1,844,590 |
423 |
98 |
31 |
20,219 |
18,751 |
38,970 |
1,066 |
387 |
38,970 |
11,965 |
23,941 |
||
|
31 |
Saran ... ... „ ... |
2,338,087 |
885 |
65 |
65 |
27,903 |
26,170 |
54,073 |
10,677 |
667 |
54,073 |
16,378 |
32,057 |
||
|
32 |
Champaran ... ... „ ... |
1,752,037 |
498 |
45 |
45 |
25,372 |
24,339 |
49,711 |
13,343 |
808 |
49,708 |
16,299 |
31,970 |
||
|
33 |
Muzaffarpur ... ... „ ... |
2,666,735 |
897 |
53 |
53 |
45,608 |
43,034 |
88,642 |
23,720 |
1,225 |
88,637 |
34,176 |
53,666 |
||
|
34 |
Darbhanga ... ... „ ... |
2,809,219 |
846 |
53 |
53 |
45,227 |
42,850 |
88,077 |
17,003 |
1,341 |
88,070 |
50,193 |
37,258 |
||
|
Total of Patna Divi- |
Paid by District |
14,782,406 |
627 |
5 |
... |
2,923 |
2,978 |
5,901 |
... |
1,180 |
5,874 |
2,871 |
2,574 |
||
|
Licensed ... |
446 |
333 |
207,211 |
197,351 |
404,562 |
71,059 |
748 |
404,487 |
166,913 |
220,683 |
|||||
|
Total ... |
451 |
333 |
210,134 |
200,329 |
410,463 |
71,059 |
752 |
410,361 |
169,784 |
223,257 |
|||||
Set display mode to: Large image | Zoom image | Transcription
Images and transcriptions on this page, including medium image downloads, may be used under the Creative Commons Attribution 4.0 International Licence unless otherwise stated. ![]()
| Permanent URL | https://digital.nls.uk/91540716 |
|---|
| Description | Covers 1896-1909. Details and appraises vaccination operations in the Province of Bengal. Describes manufacture and storage of lymph. Tables show particulars of vaccination. Success and mortality rates noted. Diagrams included. |
|---|---|
| Shelfmark | IP/6/VA.3 |
| Additional NLS resources: | |
| Attribution and copyright: |
|
| Description | The Vaccination collection consists of 66 volumes dating from 1856 to 1933. Reports show how vaccination against smallpox was implemented in India. They reveal the shift from variolation, improved vaccination techniques, logistics of lymph supply, funding and staffing. They explore how the local population viewed and resisted western vaccination. |
|---|---|
| Description | The India Papers collection contains publications of the central (Imperial) Government and many Indian states. Most states came under British rule. Much of the collection dates from between the post-Mutiny re-organisation of the Indian Government and Indian Independence in 1947. Some items published in London by John Murray. |
|---|---|
| Shelfmark | India Papers |
| Additional NLS resources: | |