

Medicine - Vaccination > 1896-1909 - Annual statistical returns and brief notes on vaccination in Bengal > 1896-1899 - Fourth triennial report of vaccination in Bengal during the years 1896-99
(17) Page 7
Download files
Individual page:
Thumbnail gallery: Grid view | List view
( 7 )
It is satisfactory to notice that there was an increase of 130,006 primary
vaccinations during the period under review, as compared with the previous
triennial period. The ratio per cent. of successful cases shows a decrease of
.37, being 97.92, against 98.29 of 1893-96. As explained in previous reports,
this high ratio is due to the dishonest practice followed by the vaccinators of
including in the returns partial and even absolute failures as successful
cases. This can only be put a stop to by stricter supervision by the Civil
Surgeons and the local inspecting staff.
Protection afforded to infants .
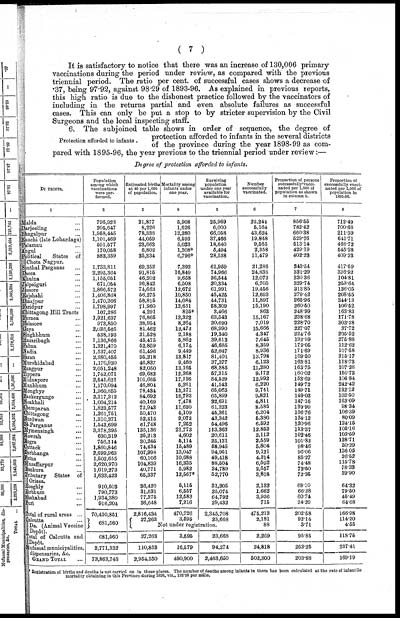
6. The subjoined table shows in order of sequence, the degree of
protection afforded to infants in the several districts
of the province during the year 1898-99 as com-
pared with 1895-96, the year previous to the triennial period under review:—
Degree of protection afforded to infants.
|
DISTRICTS. |
Population |
Estimated births |
Mortality among |
Surviving |
Number |
Proportion of persons |
Proportion of |
|
1 |
2 |
3 |
8 |
5 |
6 |
7 |
8 |
|
Malda ... |
796,923 |
31,877 |
5,908 |
25,969 |
22,244 |
856.55 |
712.49 |
|
Darjeeling ... |
205,647 |
8,226 |
1,626 |
6,600 |
5,164 |
782.42 |
700.68 |
|
Bhagalpur ... |
1,958,445 |
78,338 |
12,280 |
66,058 |
43,624 |
660.38 |
211.39 |
|
Ranchi (late Lohardaga) |
1,101,469 |
44,059 |
6,593 |
37,466 |
19,848 |
529.76 |
641.71 |
|
Palamau ... |
591,577 |
23,663 |
5,023 |
18,640 |
9,565 |
513.14 |
466.72 |
|
Angul ... |
170,058 |
6,802 |
1,308* |
5,494 |
2,358 |
429.19 |
545.28 |
|
Political States of |
883,359 |
35,334 |
6,796* |
28,538 |
11,479 |
402.23 |
409.33 |
|
Sonthal Parganas ... |
1,733,811 |
69,352 |
7,393 |
61,959 |
21,286 |
343.54 |
417.59 |
|
Dacca ... |
2,295,364 |
91,815 |
16,849 |
74,966 |
24,836 |
331.29 |
336.92 |
|
Khulna ... |
1,155,051 |
46,202 |
9,658 |
36,544 |
12,073 |
330.36 |
104.81 |
|
Jalpaiguri ... |
671,054 |
26,842 |
6,508 |
20,334 |
6,705 |
329.74 |
258.64 |
|
Jessore ... |
1,866,572 |
74,663 |
12,672 |
61,991 |
19,456 |
313.85 |
136.05 |
|
Rajshahi ... |
1,406,868 |
56,275 |
10,850 |
45,425 |
12,693 |
279.42 |
208.55 |
|
Dinajpur ... |
1,470,366 |
58,815 |
14,084 |
44,731 |
11,897 |
265.96 |
344.13 |
|
Faridpur ... |
1,798,997 |
71,960 |
13,651 |
58,309 |
15,190 |
260.50 |
106.52 |
|
Chittagong Hill Tracts |
107,286 |
4,291 |
825* |
3,466 |
863 |
248.99 |
163.83 |
|
Purnea ... |
1,921,637 |
76,865 |
13,322 |
63,543 |
15,167 |
238.68 |
171.78 |
|
Balasore ... |
973,850 |
38,954 |
8,264 |
30,690 |
7,019 |
228.70 |
303.28 |
|
Gaya ... |
2,036,565 |
81,462 |
12,472 |
68,990 |
15,666 |
227.07 |
37.72 |
|
Singbhum ... |
538,193 |
21,528 |
2,188 |
19,340 |
4,347 |
224.76 |
205.52 |
|
Hazaribagh ... |
1 ,136,866 |
45,475 |
5,862 |
39,613 |
7,645 |
192.99 |
275.88 |
|
Pabna ... |
1,321,470 |
52,859 |
6,174 |
46,685 |
8,359 |
179.05 |
112.62 |
|
Nadia ... |
1,537,407 |
61,496 |
9,449 |
52,047 |
8,936 |
171.69 |
107.58 |
|
Saran ... |
2,380,455 |
95,218 |
13,817 |
81,401 |
13,798 |
169.50 |
215.17 |
|
Murshidabad ... |
1,170,930 |
46,837 |
9,460 |
37,377 |
6,123 |
163.81 |
118.73 |
|
Rangpur ... |
2,051,248 |
82,050 |
13,165 |
68,885 |
11,280 |
163.75 |
107.28 |
|
Tippera ... |
1,742,071 |
69,683 |
12,368 |
57,315 |
9,172 |
160.02 |
150.73 |
|
Midnapore ... |
2,541,621 |
101,665 |
17,136 |
84,529 |
12,992 |
153.69 |
106.84 |
|
Manbhum ... |
1,170,094 |
46,801 |
5,261 |
41,543 |
6,220 |
149.72 |
242.42 |
|
Monghyr ... |
1,960,855 |
78,434 |
13,371 |
65,063 |
9,741 |
149.71 |
132.12 |
|
Backergunge ... |
2,117,312 |
84,692 |
18,793 |
65,899 |
9,821 |
149.03 |
103.50 |
|
Noakhali ... |
1,004,214 |
40,169 |
7,478 |
32,691 |
4,811 |
147.16 |
163.09 |
|
Champaran ... |
1,823,577 |
72,943 |
11,620 |
61,323 |
8,585 |
139.99 |
98.34 |
|
Chittagong ... |
1,261,751 |
50,470 |
5,109 |
45,361 |
6,204 |
136.76 |
106.39 |
|
Burdwan ... |
1,310,371 |
52,415 |
9,073 |
43,342 |
5,380 |
124.12 |
80.09 |
|
24-Parganas ... |
1,543,699 |
61,748 |
7,252 |
54,496 |
6,592 |
120.96 |
124.15 |
|
Mymensingh ... |
3,378,395 |
135,136 |
21,773 |
113,363 |
12,852 |
113.37 |
105.16 |
|
Howrah ... |
630,319 |
25,213 |
4,602 |
20,611 |
2,112 |
102.46 |
103.59 |
|
Bogra ... |
756,114 |
30,245 |
5,114 |
25,131 |
2,559 |
101.82 |
128.71 |
|
Cuttack ... |
1,860,846 |
74,434 |
15,489 |
58,945 |
5,804 |
98.46 |
30.29 |
|
Darbhanga ... |
2,699,963 |
107,998 |
13,047 |
94,951 |
9,121 |
96.06 |
136.05 |
|
Patna ... |
1,502,655 |
60,106 |
10,688 |
49,418 |
4,214 |
85.27 |
26.52 |
|
Muzaffarpur ... |
2,620,970 |
104,839 |
16,335 |
88,504 |
6,592 |
74.48 |
115.78 |
|
Bankura ... |
1,019,273 |
40,771 |
5,982 |
34,789 |
2,557 |
73.50 |
78.33 |
|
Tributary States of |
1,633,423 |
65,337 |
12,567* |
52,770 |
3,818 |
72.35 |
39.90 |
|
Hooghly ... |
910,503 |
36,420 |
5,115 |
31,305 |
2,132 |
68.10 |
64.32 |
|
Birbhum ... |
790,773 |
31,631 |
6,557 |
25,074 |
1,662 |
66.28 |
79.50 |
|
Shahabad ... |
1,934,380 |
77,375 |
12,583 |
64,792 |
3,936 |
60.74 |
45.49 |
|
Puri ... |
916,204 |
36,648 |
7,216 |
29,432 |
715 |
24.29 |
64.68 |
|
Total of rural areas ... |
70,410,851 |
2,816,434 |
470,726 |
2,345,708 |
475,213 |
202.58 |
166.98 |
|
Calcutta ... |
681,560 |
27,263 |
3,595 |
23,668 |
2,181 |
92.14 |
114.20 |
|
Do. (Animal Vaccine |
Not under registration. |
88 |
3.71 |
4.55 |
|||
|
Total of Calcutta and |
681,560 |
27,263 |
3,595 |
23,668 |
2,269 |
95.85 |
118.75 |
|
Mufassal municipalities, |
2,771,332 |
110,853 |
16,579 |
94,274 |
24,818 |
263.25 |
237.41 |
|
GRAND TOTAL ... |
73,863,743 |
2,954,550 |
490,900 |
2,463,650 |
502,300 |
203.88 |
169.19 |
* Registration of births and deaths is not carried on in these places. The number of deaths among infants in them has been calculated at the rate of infantile
mortality obtaining in this Province during 1898, viz., 192.35 per mille.
Set display mode to: Large image | Zoom image | Transcription
Images and transcriptions on this page, including medium image downloads, may be used under the Creative Commons Attribution 4.0 International Licence unless otherwise stated. ![]()
| Permanent URL | https://digital.nls.uk/91539735 |
|---|
| Description | Covers 1896-1909. Details and appraises vaccination operations in the Province of Bengal. Describes manufacture and storage of lymph. Tables show particulars of vaccination. Success and mortality rates noted. Diagrams included. |
|---|---|
| Shelfmark | IP/6/VA.3 |
| Additional NLS resources: | |
| Attribution and copyright: |
|
| Description | The Vaccination collection consists of 66 volumes dating from 1856 to 1933. Reports show how vaccination against smallpox was implemented in India. They reveal the shift from variolation, improved vaccination techniques, logistics of lymph supply, funding and staffing. They explore how the local population viewed and resisted western vaccination. |
|---|---|
| Description | The India Papers collection contains publications of the central (Imperial) Government and many Indian states. Most states came under British rule. Much of the collection dates from between the post-Mutiny re-organisation of the Indian Government and Indian Independence in 1947. Some items published in London by John Murray. |
|---|---|
| Shelfmark | India Papers |
| Additional NLS resources: | |