

Medicine - Vaccination > 1887-1898 - Annual statistical returns and brief notes on vaccination in Bengal > 1893-1896 - Triennial report of vaccination in Bengal during the years 1893-96
(371) Page 15
Download files
Individual page:
Thumbnail gallery: Grid view | List view
( 15 )
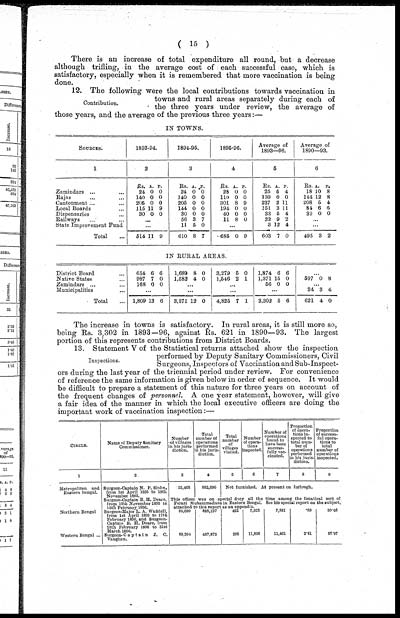
There is an increase of total expenditure all round, but a decrease
although trifling, in the average cost of each successful case, which is
satisfactory, especially when it is remembered that more vaccination is being
done.
Contribution.
12. The following were the local contributions towards vaccination in
towns and rural areas separately during each of
the three years under review, the average of
those years, and the average of the previous three years:—
IN TOWNS.
|
SOURCES. |
1893-94. |
1894-95. |
1895-96. |
Average of |
Average of |
||||||||||
|
1 |
2 |
3 |
4 |
5 |
6 |
||||||||||
|
Rs. |
A. |
P. |
Rs. |
A. |
P. |
Rs. |
A. |
P. |
Rs. |
A. |
P. |
Rs. |
A. |
P. |
|
|
Zamindars ... ... |
24 |
0 |
0 |
24 |
0 |
0 |
28 |
0 |
0 |
25 |
5 |
4 |
18 |
10 |
8 |
|
Rajas ... ... |
140 |
0 |
0 |
140 |
0 |
0 |
110 |
0 |
0 |
130 |
0 |
0 |
144 |
12 |
8 |
|
Cantonment ... ... |
205 |
0 |
0 |
205 |
0 |
0 |
301 |
8 |
9 |
237 |
2 |
11 |
208 |
5 |
4 |
|
Local Boards ... |
115 |
11 |
9 |
144 |
0 |
0 |
194 |
0 |
0 |
151 |
3 |
11 |
84 |
6 |
6 |
|
Dispensaries ... |
30 |
0 |
0 |
30 |
0 |
0 |
40 |
0 |
0 |
33 |
5 |
4 |
39 |
0 |
0 |
|
Railways ... ... |
... |
56 |
3 |
7 |
11 |
8 |
0 |
22 |
9 |
2 |
... |
||||
|
State Improvement Fund |
... |
11 |
5 |
0 |
... |
3 |
12 |
4 |
... |
||||||
|
Total ... |
514 |
11 |
9 |
610 |
8 |
7 |
685 |
0 |
9 |
603 |
7 |
0 |
495 |
3 |
2 |
|
IN RURAL AREAS. |
|||||||||||||||
|
District Board ... |
654 |
6 |
6 |
1,689 |
8 |
0 |
3,279 |
5 |
0 |
1,874 |
6 |
6 |
... |
||
|
Native States ... |
987 |
7 |
0 |
1,582 |
4 |
0 |
1,546 |
2 |
1 |
1,371 |
15 |
0 |
597 |
0 |
8 |
|
Zamindars ... ... |
168 |
0 |
0 |
... |
... |
56 |
0 |
0 |
... |
||||||
|
Municipalities ... |
... |
... |
... |
... |
24 |
3 |
4 |
||||||||
|
Total ... |
1,809 |
13 |
6 |
3,271 |
12 |
0 |
4,825 |
7 |
1 |
3,302 |
5 |
6 |
621 |
4 |
0 |
The increase in towns is satisfactory. In rural areas, it is still more so,
being Rs. 3,302 in 1893—96, against Rs. 621 in 1890—93. The largest
portion of this represents contributions from District Boards.
Inspections.
13. Statement V of the Statistical returns attached show the inspection
performed by Deputy Sanitary Commissioners, Civil
Surgeons, Inspectors of Vaccination and Sub-Inspect-
ors during the last year of the triennial period under review. For convenience
of reference the same information is given below in order of sequence. It would
be difficult to prepare a statement of this nature for three years on account of
the frequent changes of personnel. A one year statement, however, will give
a fair idea of the manner in which the local executive officers are doing the
important work of vaccination inspection:—
|
CIRCLE. |
Name of Deputy Sanitary |
Number |
Total |
Total |
Number |
Number of |
Proportion |
Proportion |
|
1 |
2 |
3 |
4 |
5 |
6 |
7 |
8 |
9 |
|
Metropolitan and |
Surgeon-Captain N. P. Sinha, |
55,463 |
882,096 |
Not furnished. At present on furlough. |
||||
|
Surgeon-Captain B. H. Deare, |
This officer was on special duty all the time among the fanatical sect of |
|||||||
|
Northern Bengal |
Surgeon-Major L. A. Waddell, |
95,699 |
888,197 |
422 |
7,923 |
7,881 |
.89 |
99.46 |
|
Western Bengal ... |
Surgeon- Captain J. C. |
89,204 |
487,875 |
208 |
11,806 |
11,461 |
2.41 |
97.07 |
Set display mode to: Large image | Zoom image | Transcription
Images and transcriptions on this page, including medium image downloads, may be used under the Creative Commons Attribution 4.0 International Licence unless otherwise stated. ![]()
| Permanent URL | https://digital.nls.uk/91538991 |
|---|
| Description | Covers 1887-1898. Details and appraises vaccination operations in the Province of Bengal. Describes manufacture and storage of lymph. Tables show particulars of vaccination. Success and mortality rates noted. Diagrams included. |
|---|---|
| Shelfmark | IP/6/VA.3 |
| Additional NLS resources: | |
| Attribution and copyright: |
|
| Description | The Vaccination collection consists of 66 volumes dating from 1856 to 1933. Reports show how vaccination against smallpox was implemented in India. They reveal the shift from variolation, improved vaccination techniques, logistics of lymph supply, funding and staffing. They explore how the local population viewed and resisted western vaccination. |
|---|---|
| Description | The India Papers collection contains publications of the central (Imperial) Government and many Indian states. Most states came under British rule. Much of the collection dates from between the post-Mutiny re-organisation of the Indian Government and Indian Independence in 1947. Some items published in London by John Murray. |
|---|---|
| Shelfmark | India Papers |
| Additional NLS resources: | |