

Medicine - Vaccination > 1887-1898 - Annual statistical returns and brief notes on vaccination in Bengal > 1891-1892 - Annual statistical returns and brief notes on vaccination in Bengal for the year 1891-92
(114) Page 4
Download files
Individual page:
Thumbnail gallery: Grid view | List view
( 4 )
Comparative value of work per-
formed by Government, Licensed
and Municipal Agency.
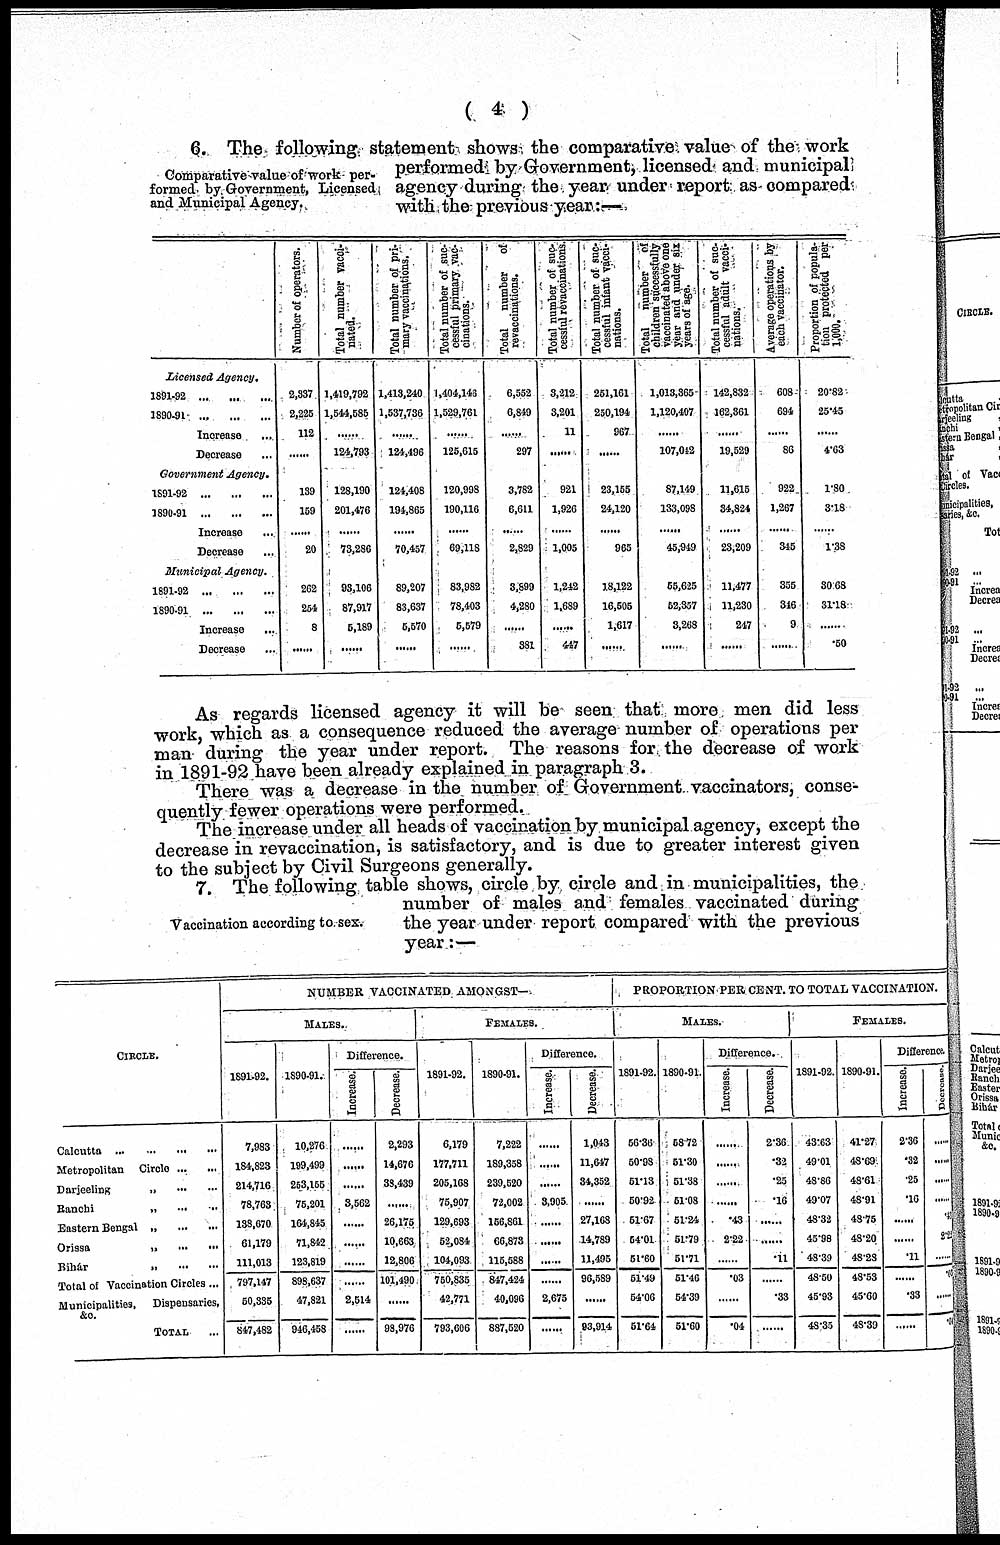
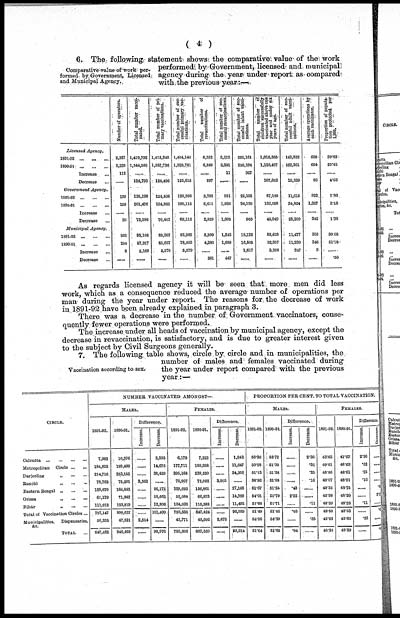
6. The following statement shows the comparative value of the work
performed by Government, licensed and municipal
agency during the year under report as compared
with the previous year:—
|
Number of operators. |
Total number vacci- |
Total number of pri- |
Total number of suc- |
Total number of |
Total number of suc- |
Total number of suc- |
Total number of |
Total number of suc- |
Average operations by |
Proportion of popula- |
|
|
Licensed Agency. |
|||||||||||
|
1891-92 ... ... ... |
2,337 |
1,419,792 |
1,413,240 |
1,404,146 |
6,552 |
3,212 |
251,161 |
1,013,365 |
142,832 |
608 |
20.82 |
|
1890-91 ... ... ... |
2,225 |
1,544,585 |
1,537,736 |
1,529,761 |
6,849 |
3,201 |
250,194 |
1,120,407 |
162,361 |
694 |
25.45 |
|
Increase ... |
112 |
...... |
...... |
...... |
...... |
11 |
967 |
...... |
...... |
...... |
...... |
|
Decrease ... |
...... |
124,793 |
124,496 |
125,615 |
297 |
...... |
...... |
107,042 |
19,529 |
86 |
4.63 |
|
Government Agency. |
|||||||||||
|
1891-92 ... ... ... |
139 |
128,190 |
124,408 |
120,998 |
3,782 |
921 |
23,155 |
87,149 |
11,615 |
922 |
1.80 |
|
1890-91 ... ... ... |
159 |
201,476 |
194,865 |
190,116 |
6,611 |
1,926 |
24,120 |
133,098 |
34,824 |
1,267 |
3.18 |
|
Increase ... |
...... |
...... |
...... |
...... |
...... |
...... |
...... |
...... |
...... |
...... |
...... |
|
Decrease ... |
20 |
73,286 |
70,457 |
69,118 |
2,829 |
1,005 |
965 |
45,949 |
23,209 |
345 |
1.38 |
|
Municipal Agency. |
|||||||||||
|
1891-92 ... ... ... |
262 |
93,106 |
89,207 |
83,982 |
3,899 |
1,242 |
18,122 |
55,625 |
11,477 |
355 |
30.68 |
|
1890-91 ... ... ... |
254 |
87,917 |
83,637 |
78,403 |
4,280 |
1,689 |
16,505 |
52,357 |
11,230 |
346 |
31.18 |
|
Increase ... |
8 |
5,189 |
5,570 |
5,579 |
...... |
...... |
1,617 |
3,268 |
247 |
9 |
... |
|
Decrease ... |
...... |
...... |
...... |
...... |
381 |
447 |
...... |
...... |
...... |
...... |
.50 |
As regards licensed agency it will be seen that more men did less
work, which as a consequence reduced the average number of operations per
man during the year under report. The reasons for the decrease of work
in 1891-92 have been already explained in paragraph 3.
There was a decrease in the number of Government vaccinators, conse-
quently fewer operations were performed.
The increase under all heads of vaccination by municipal agency, except the
decrease in revaccination, is satisfactory, and is due to greater interest given
to the subject by Civil Surgeons generally.
Vaccination according to sex.
7. The following table shows, circle by circle and in municipalities, the
number of males and females vaccinated during
the year under report compared with the previous
year.:—
|
CIRCLE. |
NUMBER VACCINATED AMONGST— |
PROPORTION PER CENT. TO TOTAL VACCINATION. |
||||||||||||||
|
MALES. |
FEMALES. |
MALES. |
FEMALES. |
|||||||||||||
|
1891-92. |
1890-91. |
Difference. |
1891-92. |
1890-91. |
Difference. |
1891-92. |
1890-91. |
Difference. |
1891-92. |
1890-91. |
Difference. |
|||||
|
Increase. |
Decrease. |
Increase. |
Decrease. |
Increase. |
Decrease. |
Increase. |
Decrease. |
|||||||||
|
Calcutta ... ... ... ... |
7,983 |
10,276 |
...... |
2,293 |
6,179 |
7,222 |
...... |
1,043 |
56.36 |
58.72 |
...... |
2.36 |
43.63 |
41.27 |
2.36 |
...... |
|
Metropolitan Circle ... ... |
184,823 |
199,499 |
...... |
14,676 |
177,711 |
189,358 |
...... |
11,647 |
50.98 |
51.30 |
...... |
.32 |
49.01 |
48.69 |
.32 |
...... |
|
Darjeeling „ ... ... |
214,716 |
253,155 |
...... |
33,439 |
205,168 |
239,520 |
...... |
34,352 |
51.13 |
51.38 |
...... |
.25 |
48.86 |
48.61 |
.25 |
...... |
|
Ranchi „ ... ... |
78,763 |
75,201 |
3,562 |
...... |
75,907 |
72,002 |
3,905 |
...... |
50.92 |
51.08 |
...... |
.16 |
49.07 |
48.91 |
.16 |
...... |
|
Eastern Bengal „ ... ... |
138,670 |
164,845 |
...... |
26,175 |
129,693 |
156,861 |
...... |
27,168 |
51.67 |
51.24 |
.43 |
...... |
48.32 |
48.75 |
...... |
.43 |
|
Orissa „ ... ... |
61,179 |
71,842 |
...... |
10,663 |
52,084 |
66,873 |
...... |
14,789 |
54.01 |
51.79 |
2.22 |
...... |
45.98 |
48.20 |
...... |
2.20 |
|
Bihár „ ... ... |
111,013 |
123,819 |
...... |
12,806 |
104,093 |
115,588 |
...... |
11,495 |
51.60 |
51.71 |
...... |
.11 |
48.39 |
48.28 |
.11 |
...... |
|
Total of Vaccination Circles... |
797,147 |
898,637 |
...... |
101,490 |
750,835 |
847,424 |
...... |
96,589 |
51.49 |
51.46 |
.03 |
...... |
48.50 |
48.53 |
...... |
.0 |
|
Municipalities. Dispensaries, |
50,335 |
47,821 |
2,514 |
...... |
42,771 |
40,096 |
2,675 |
...... |
54.06 |
54.39 |
...... |
.33 |
45.93 |
45.60 |
.33 |
...... |
|
TOTAL ... |
847,482 |
946,458 |
...... |
98,976 |
793,606 |
887,520 |
...... |
93,914 |
51.64 |
51.60 |
.04 |
...... |
48.35 |
48.39 |
...... |
.04 |
Set display mode to: Large image | Zoom image | Transcription
Images and transcriptions on this page, including medium image downloads, may be used under the Creative Commons Attribution 4.0 International Licence unless otherwise stated. ![]()
| Permanent URL | https://digital.nls.uk/91538202 |
|---|
| Description | Covers 1887-1898. Details and appraises vaccination operations in the Province of Bengal. Describes manufacture and storage of lymph. Tables show particulars of vaccination. Success and mortality rates noted. Diagrams included. |
|---|---|
| Shelfmark | IP/6/VA.3 |
| Additional NLS resources: | |
| Attribution and copyright: |
|
| Description | The Vaccination collection consists of 66 volumes dating from 1856 to 1933. Reports show how vaccination against smallpox was implemented in India. They reveal the shift from variolation, improved vaccination techniques, logistics of lymph supply, funding and staffing. They explore how the local population viewed and resisted western vaccination. |
|---|---|
| Description | The India Papers collection contains publications of the central (Imperial) Government and many Indian states. Most states came under British rule. Much of the collection dates from between the post-Mutiny re-organisation of the Indian Government and Indian Independence in 1947. Some items published in London by John Murray. |
|---|---|
| Shelfmark | India Papers |
| Additional NLS resources: | |