Medicine - Vaccination > 1887-1898 - Annual statistical returns and brief notes on vaccination in Bengal > 1890-1891 - Annual statistical returns and brief notes on vaccination in Bengal for the year 1890-91
(71) Page 5
Download files
Individual page:
Thumbnail gallery: Grid view | List view

( 5 )
Vaccination according to sex.
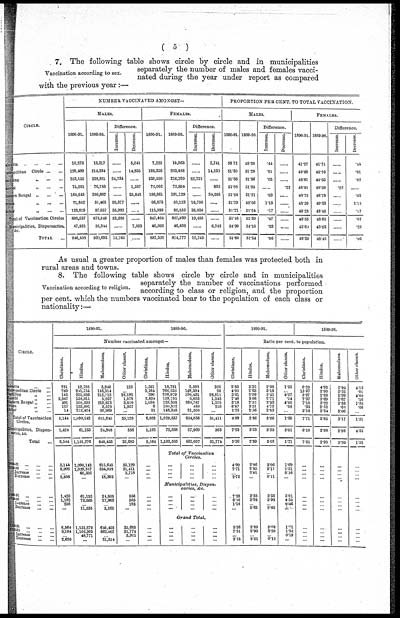
7. The following table shows circle by circle and in municipalities
separately the number of males and females vacci-
nated during the year under report as compared
with the previous year:—
|
CIRCLE. |
NUMBER VACCINATED AMONGST— |
PROPORTION PER CENT. TO TOTAL VACCINATION. |
||||||||||||||
|
MALES. |
FEMALES. |
MALES. |
FEMALES. |
|||||||||||||
|
1890-91. |
1889.90. |
Difference. |
1890-91. |
1889-90. |
Difference. |
1890-91. |
1889-90. |
Difference. |
1890-91. |
1889-90. |
Difference. |
|||||
|
Increase. |
Decrease. |
Increase. |
Decrease. |
Increase. |
Decrease. |
lncrease. |
Decrease. |
|||||||||
|
Calcatta ... ... ... ... |
10,276 |
15,317 |
...... |
5,041 |
7,222 |
10,963 |
...... |
3,741 |
58.72 |
58.28 |
.44 |
...... |
41.27 |
41.71 |
...... |
.44 |
|
Metropolitan Circle ... ... |
199,499 |
214,334 |
......... |
14,835 |
189,358 |
203,488 |
...... |
11,130 |
51.30 |
51.29 |
.01 |
...... |
43.69 |
48.70 |
...... |
.01 |
|
Darjiling „ ... ... |
253,155 |
228,921 |
24,234 |
...... |
239,520 |
216,790 |
22,730 |
...... |
51.38 |
51.36 |
.02 |
...... |
48.61 |
48.63 |
...... |
.02 |
|
Ranchi „ ... ... |
75,201 |
76,788 |
...... |
1,587 |
72,002 |
72,894 |
...... |
892 |
51.08 |
51.30 |
...... |
.22 |
48.91 |
48.69 |
.22 |
...... |
|
Eastern Bengal „ ... ... |
164,845 |
200,687 |
...... |
35,842 |
156,861 |
191,129 |
...... |
34,268 |
51.24 |
51.21 |
.03 |
...... |
48.75 |
48.78 |
...... |
.03 |
|
Orrisa „ ... ... |
71,842 |
51,465 |
20,377 |
...... |
66,873 |
50,123 |
16,750 |
...... |
51.79 |
50.66 |
1.13 |
...... |
48.20 |
49.33 |
...... |
1.13 |
|
Behar „ ... ... |
123,819 |
87,837 |
35,982 |
...... |
115,588 |
82,552 |
33,036 |
...... |
51.71 |
51.54 |
.17 |
...... |
48.28 |
48.45 |
...... |
.17 |
|
Total of Vaccination Circles |
898,637 |
875,349 |
23,288 |
...... |
847,424 |
827,939 |
19,485 |
...... |
51.46 |
51.39 |
.07 |
...... |
48.53 |
48.60 |
...... |
.07 |
|
Municipalities, Dispensaries, |
47,821 |
55,344 |
...... |
7,523 |
40,096 |
46,833 |
...... |
6,742 |
54.39 |
54.16 |
.23 |
...... |
45.60 |
45.83 |
...... |
.23 |
|
TOTAL ... |
946,458 |
930,693 |
15,765 |
...... |
887,520 |
874,777 |
12,743 |
...... |
51.60 |
51.54 |
.06 |
...... |
48.39 |
48.45 |
...... |
.06 |
As usual a greater proportion of males than females was protected both in
rural areas and towns.
Vaccination according to religion.
8. The following table shows circle by circle and in municipalities
separately the number of vaccinations performed
according to class or religion, and the proportion
per cent. which the numbers vaccinated bear to the population of each class or
nationality:—
|
CIRCLE. |
1890-91. |
1889-90. |
1890-91. |
1889-90. |
||||||||||||
|
Number vaccinated amongst— |
Ratio per cent. to population. |
|||||||||||||||
|
Christians. |
Hindus. |
Mahomodans. |
Other classes. |
Christians. |
Hindus. |
Mahomodans. |
Other classes. |
Christians. |
Hindus. |
Mahomedans. |
Other classes. |
Christians. |
Hindus. |
Mahomedans. |
Other classes. |
|
|
Calcatta ... ... |
731 |
12,705 |
3,940 |
122 |
1,581 |
18,781 |
5,593 |
325 |
2.83 |
3.35 |
2.08 |
1.55 |
6.20 |
4.95 |
2.94 |
4.13 |
|
Metropolitan Circle ... |
789 |
241,754 |
146,314 |
... |
2,164 |
266,236 |
149,394 |
28 |
4.98 |
2.63 |
3.18 |
... |
13.67 |
2.90 |
3.25 |
.01 |
|
Darjiling „ ... |
145 |
251,626 |
212,712 |
28,192 |
290 |
226,979 |
190,431 |
28,011 |
3.01 |
2.99 |
3.41 |
4.27 |
5.87 |
2.68 |
2.99 |
4.09 |
|
Ranchi „ ... |
2,847 |
138,011 |
5,267 |
1,078 |
2,834 |
139,753 |
5,853 |
1,242 |
7.40 |
3.66 |
2.71 |
.14 |
7.37 |
3.69 |
2.67 |
.16 |
|
Eastern Bengal „ ... |
491 |
100,532 |
216,873 |
3,810 |
1,096 |
128,358 |
260,787 |
1,575 |
3.18 |
2.52 |
2.93 |
4.65 |
7.10 |
3.22 |
3.33 |
1.85 |
|
Orissa „ ... |
127 |
133,091 |
3,570 |
1,927 |
6 |
100,872 |
480 |
250 |
6.87 |
3.31 |
4.72 |
.58 |
.33 |
2.52 |
.63 |
.06 |
|
Behar „ ... |
14 |
212,424 |
26,969 |
... |
31 |
148,858 |
21,500 |
... |
1.25 |
2.36 |
2.83 |
... |
3.16 |
2.34 |
3.06 |
|
|
Total of Vaccination |
5,144 |
1,090,143 |
615,645 |
35,129 |
8,002 |
1,029,837 |
634,038 |
31,411 |
4.99 |
2.86 |
3.06 |
1.69 |
7.71 |
2.85 |
3.17 |
1.51 |
|
Municipalities, Dispen- |
1,420 |
61,133 |
24,808 |
556 |
1,182 |
72,668 |
27,969 |
363 |
7.28 |
3.33 |
3.53 |
5.01 |
6.10 |
3.98 |
3.98 |
4.55 |
|
Total ... |
6,564 |
1,151,276 |
640,453 |
35,685 |
9,184 |
1,102,505 |
662,007 |
31,774 |
5.36 |
2.89 |
3.08 |
1.71 |
7.51 |
2.90 |
3.20 |
1.52 |
|
Total of Vaccination |
||||||||||||||||
|
1890-91 ... ... ... |
5,144 |
1,090,143 |
615,645 |
35,129 |
... |
... |
... |
... |
4.99 |
2.86 |
3.06 |
1.69 |
... |
... |
... |
... |
|
1889-90 ... ... ... |
8,002 |
1,029,837 |
634,038 |
31,411 |
... |
... |
... |
... |
7.71 |
2.85 |
3.17 |
1.51 |
... |
... |
... |
... |
|
Increase ... ... |
... |
60,306 |
... |
3,718 |
... |
... |
... |
... |
... |
0.01 |
... |
0.16 |
... |
... |
... |
... |
|
Decrease ... ... |
2,858 |
... |
18,393 |
... |
... |
... |
... |
... |
2.72 |
... |
0.11 |
... |
... |
... |
... |
... |
|
Municipalities, Dispen- |
||||||||||||||||
|
1890-91 ... ... ... |
1,420 |
61,133 |
24,808 |
556 |
... |
... |
... |
... |
7.28 |
3.33 |
3.53 |
5.01 |
... |
... |
... |
... |
|
1889-90 ... ... ... |
1,182 |
72,668 |
27,969 |
363 |
... |
... |
... |
... |
6.10 |
3.98 |
3.98 |
4.55 |
... |
... |
... |
... |
|
Increase ... ... |
238 |
... |
... |
193 |
... |
... |
... |
... |
1.18 |
... |
... |
0.46 |
... |
... |
... |
... |
|
Decrease ... ... |
... |
11,535 |
3,161 |
... |
... |
... |
... |
... |
... |
0.65 |
0.45 |
... |
... |
... |
... |
... |
|
Grand Total. |
||||||||||||||||
|
1890-91 ... ... ... |
6,564 |
1,151,276 |
640,453 |
35,685 |
... |
... |
... |
... |
5.36 |
2.89 |
3.08 |
1.71 |
... |
... |
... |
... |
|
1889-90 ... ... ... |
9,184 |
1,102,505 |
662,007 |
31,774 |
... |
... |
... |
... |
7.5l |
2.90 |
3.20 |
1.52 |
... |
... |
... |
... |
|
Increase ... ... |
... |
48,771 |
... |
3,911 |
... |
... |
... |
... |
... |
... |
... |
0.19 |
... |
... |
... |
... |
|
Decrease ... ... |
2,620 |
... |
21,554 |
... |
... |
... |
... |
... |
2.15 |
0.01 |
0.12 |
... |
... |
... |
... |
... |
Set display mode to: Large image | Zoom image | Transcription
Images and transcriptions on this page, including medium image downloads, may be used under the Creative Commons Attribution 4.0 International Licence unless otherwise stated. ![]()
| Permanent URL | https://digital.nls.uk/91538073 |
|---|


