

Medicine - Vaccination > 1869-1873 - Report on vaccination in the Province of Bengal > Report on vaccination in the Province of Bengal for the year ending 31st March 1872
(217) No. 583

Download files
Individual page:
Thumbnail gallery: Grid view | List view
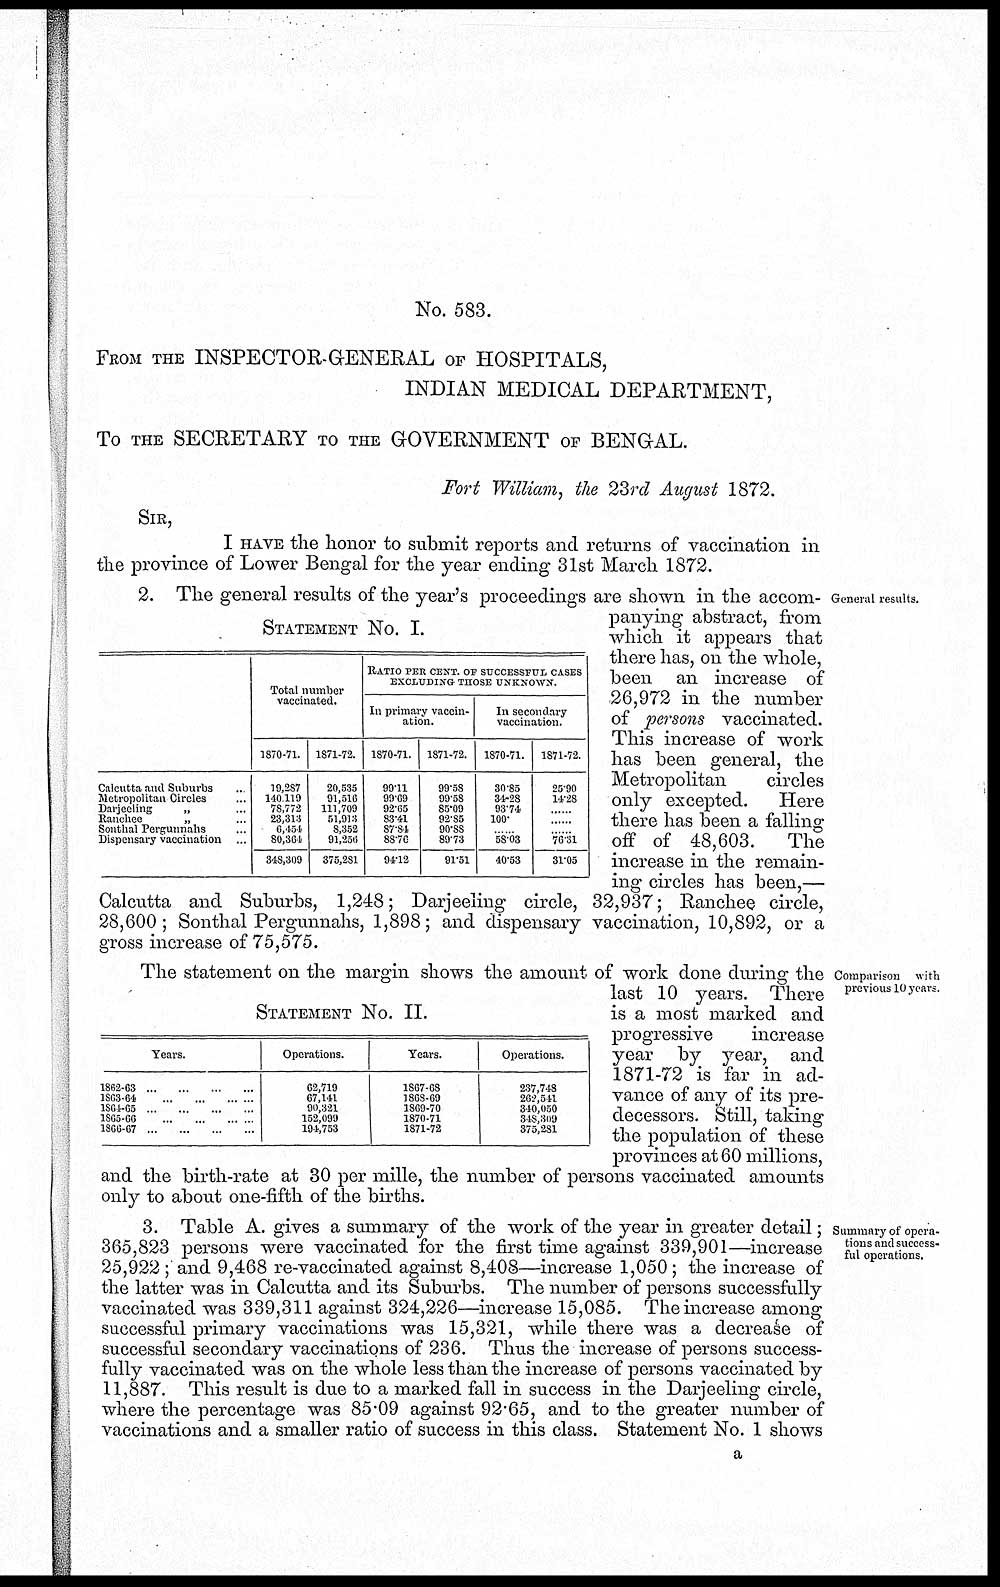
No. 583.
FROM THE INSPECTOR-GENERAL OF HOSPITALS,
INDIAN MEDICAL DEPARTMENT,
To THE SECRETARY TO THE GOVERNMENT OF BENGAL.
Fort William, the 23rd August 1872.
SIR,
I HAVE the honor to submit reports and returns of vaccination in
the province of Lower Bengal for the year ending 31st March 1872.
General results.
STATEMENT No. I.
|
Total number |
RATIO PER CENT, OF SUCCESSFUL CASES |
|||||
|
In primary vaccin- |
In secondary |
|||||
|
1870-71. |
1871-72. |
1870-71. |
1871-72. |
1870-71. |
1871-72. |
|
|
Calcutta and Suburbs ... |
19,287 |
20,535 |
99.11 |
99.58 |
30.85 |
25.90 |
|
Metropolitan Circles ... |
140,119 |
91,516 |
99.69 |
99.58 |
34.28 |
14.28 |
|
Darjeeling „ ... |
78,772 |
111,709 |
92.65 |
85.09 |
93.74 |
...... |
|
Ranchee „ ... |
23,313 |
51,913 |
83.41 |
92.85 |
100. |
...... |
|
Sonthal Pergunnahs ... |
6,454 |
8,352 |
87.84 |
90.88 |
...... |
...... |
|
Dispensary vaccination ... |
80,364 |
91,256 |
88.76 |
89.73 |
58.03 |
76.31 |
|
348,309 |
375,281 |
94.12 |
91.51 |
40.53 |
31.05 |
|
2. The general results of the year's proceedings are shown in the accom-
panying abstract, from
which it appears that
there has, on the whole,
been an increase of
26,972 in the number
of persons vaccinated.
This increase of work
has been general, the
Metropolitan circles
only excepted. Here
there has been a falling
off of 48,603. The
increase in the remain-
ing circles has been,—
Calcutta and Suburbs, 1,248; Darjeeling circle, 32,937; Ranchee circle,
28,600; Sonthal Pergunnahs, 1,898; and dispensary vaccination, 10,892, or a
gross increase of 75,575.
Comparison with
previous 10 years.
STATEMENT No. II.
|
Years. |
Operations. |
Years. |
Operations. |
|
1862-63 ... ... ... ... |
62,719 |
1867-68 |
237,748 |
|
1863-64 ... ... ... ... |
67,141 |
1868-69 |
262,541 |
|
1864-65 ... ... ... ... |
90,321 |
1869-70 |
340,050 |
|
1865-66 ... ... ... ... |
152,099 |
1870-71 |
348,309 |
|
1866-67 ... ... ... ... |
194,753 |
1871-72 |
375,281 |
The statement on the margin shows the amount of work done during the
last 10 years. There
is a most marked and
progressive increase
year by year, and
1871-72 is far in ad-
vance of any of its pre-
decessors. Still, taking
the population of these
provinces at 60 millions,
and the birth-rate at 30 per mille, the number of persons vaccinated amounts
only to about one-fifth of the births.
Summary of opera-
tions and success-
ful operations.
3. Table A. gives a summary of the work of the year in greater detail;
365,823 persons were vaccinated for the first time against 339,901—increase
25,922 ; and 9,468 re-vaccinated against 8,408—increase 1,050; the increase of
the latter was in Calcutta and its Suburbs. The number of persons successfully
vaccinated was 339,311 against 324,226—increase 15,085. The increase among
successful primary vaccinations was 15,321, while there was a decrease of
successful secondary vaccinations of 236. Thus the increase of persons success-
fully vaccinated was on the whole less than the increase of persons vaccinated by
11,887. This result is due to a marked fall in success in the Darjeeling circle,
where the percentage was 85.09 against 92.65, and to the greater number of
vaccinations and a smaller ratio of success in this class. Statement No. 1 shows
a
Set display mode to: Large image | Zoom image | Transcription
Images and transcriptions on this page, including medium image downloads, may be used under the Creative Commons Attribution 4.0 International Licence unless otherwise stated. ![]()
| India Papers > Medicine - Vaccination > Report on vaccination in the Province of Bengal > Report on vaccination in the Province of Bengal for the year ending 31st March 1872 > (217) No. 583 |
|---|
| Permanent URL | https://digital.nls.uk/91535274 |
|---|
| Additional NLS resources: | |
|---|---|
| Description | Covers 1869-1873. Details and appraises vaccination operations in the Province of Bengal. Describes manufacture and storage of lymph. Tables show particulars of vaccination. Success and mortality rates noted. Colour diagrams included. |
|---|---|
| Shelfmark | IP/6/VA.3 |
| Attribution and copyright: |
|
| Description | The Vaccination collection consists of 66 volumes dating from 1856 to 1933. Reports show how vaccination against smallpox was implemented in India. They reveal the shift from variolation, improved vaccination techniques, logistics of lymph supply, funding and staffing. They explore how the local population viewed and resisted western vaccination. |
|---|---|
| Description | The India Papers collection contains publications of the central (Imperial) Government and many Indian states. Most states came under British rule. Much of the collection dates from between the post-Mutiny re-organisation of the Indian Government and Indian Independence in 1947. Some items published in London by John Murray. |
|---|---|
| Shelfmark | India Papers |
| Additional NLS resources: | |